
Echoing the Times of Hoover
In this paper, we compare and contrast the current economic, natural, trade, and political conditions with those during the Great Depression. We compare the prelude, the response, and the political fallout of the Great Depression with that of the present day. Ultimately, investors should prepare for a potential lengthy recovery and may benefit from alternative methods to gain equity-like exposure in the event expected market returns are not available.
The Prelude
The build up to the stock market crash in October 1929 was preceded by a grand boom-and-bust cycle within the agricultural industry. During WWI, Europe was unable to grow its own food sources and relied heavily on American agricultural exports. The increased demand during the war years pushed agriculture prices higher and induced many enterprising Americans to borrow heavily to purchase farm land. Furthermore, farmers also used credit to purchase expensive tractor and other farm equipment in order to grow more, earn more, and meet rising demand.
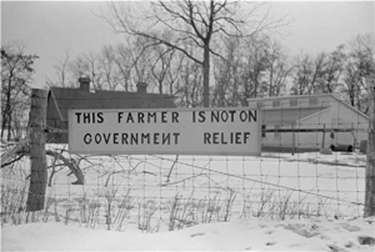
At the close of the war, prices began to fall and thus ensued the painful bust of the individual American farmer. Met with falling prices, rising taxes, and past due debt, many farmers were forced to claim bankruptcy despite many of the loans having been issued by government agencies. The knock-on effect eventually found its way to Wall Street and markets crashed.
Simultaneous to the demise of the US farmer, rampant speculation existed in stock markets. Many market participants had borrowed heavily to take advantage of the high-flying bull market, despite record valuations. In the crash, these speculators were taken out and markets permanently lost a large segment of buyers.
To make matters worse for the American farmer, a natural disaster finished them off. Drought struck many farming communities and the mounting turmoil proved fatal to the livelihoods of many good families.
Nearly 100 years later, one cannot help but notice the key similarities and the ominous potential of today’s conditions. As far as memory serves, America has relied on foreign oil imports to feed its burgeoning economy. Tensions have mounted with oil-producing countries in light of national security concerns. Thus, appetite existed to find alternative sources of energy. Within the last twenty years, technology has become available to extract energy sources through fracking. As a result, America has become an energy exporter—something once thought impossible. The opportunity for gain has induced the enterprising to invest in expensive land and equipment to farm energy.
Our own research leads us to understand that just within the companies of the S&P 500, some $200 billion of short-term debt and liabilities exist on the balance sheets of energy companies that do not have enough short-term assets to meet to meet such obligations. Those same companies have a collective weighted-average EBITDA / Short-term debt ratio of 0.40x. These figures were computed using financial statements ending December 31, 2019 when oil was $50-60 per barrel. Oil is now priced at $15 per barrel, a price at which fracking is no longer profitable. The above also says nothing about other companies, public and private, not included in the S&P 500 basket of energy companies. Therefore, the amount of debt and risk is likely much larger.
The decline in oil prices has largely come from over-production. Policy experts may debate why the Saudis and Russians continue to produce more oil than is needed and whether it is directly aimed at destroying the American fracking industry or if it is just their own politics at play. Regardless of the reasons, over-supply has pressured crude prices.
To make matters worse, nature has delivered COVID-19 which has prompted global governments to shut down economies, thereby reducing global oil demand. The pandemic could not have come at a worse time for the fracking industry.
Similar to the speculation that occurred in the build of the 1929 market crash, corporations have engaged in record share repurchases. In response to the 2008 Global Financial Crisis, the Federal Reserve reduced interest rates to near-zero for multiple years. These low rates created incentives for corporations to borrow heavily. At the same time, corporations have been the largest purchasers of their own equity shares. This dynamic has led to a stock market which has greatly outpaced core earnings for many years. For our discussion on that topic, please read our paper “Crash or Consolidation.”
With the stock market decline in response to the economic uncertainty around COVID-19, we believe few corporations have the visibility to get aggressive in buying back their own shares. Like the Great Depression, a key market participant has exited the stage—at least temporarily. Additionally, much political posturing and rhetoric has cast the share repurchases in a negative or even immoral light. Furthermore, retirees, a key demographic, will be net sellers of equities over the next 20-30 years. The combined result from the pressures on these two market groups could be felt for years.
The factors at play prior to our current market sell-off bares striking similarities to the prelude leading up to the crash of 1929: i) a challenged commodity market overburdened with debt and reliance on elevated prices, ii) a stock market outpacing its earnings and fueled by speculation, and iii) a natural disaster which further complicated/complicates the economic picture.
The General Response
On December 5, 1929, President Herbert Hoover gave a speech entitled: “Remarks to a Chamber of Commerce Conference on the Mobilization of Business and Industry for Economic Stabilization.” The link to the speech is here and can be found on pages 453-456 of the archive.
The speech reveals the mood, sentiment, and action taken in 1929 and measures well against our current back drop. The purpose is not to find evidence we are doomed to follow the same course that befell America in the Great Depression, but rather to compare similarities with our today. Our conclusion is that government action cannot ultimately hold back a breaking dam if indeed the dam is going to break.
Below are the key takeaways and quotes from the speech. We also include the modern parallel in-line:

Hoover references a speculation-fueled diversion of capital away from consumer spending into the stock market speculation as a main culprit of the crash.
2020 Parallel: Corporations have used capital more to purchase shares rather than to invest in new technology and R&D. Bailouts from 2008 were funnelled more to banks and less to “Main Street.”
- A Flood of liquidity. “The first step in recovering confidence was made by the powerful effectiveness of that system [Federal Reserve], and the strong position of the banks, the result of which has been steadily diminishing interest rates, with a smooth and rapid return into the channels of business the money previously absorbed in the speculative market.”
“Capital is becoming more abundant in all parts of the country, the bond market is growing stronger each day and already public issues held back for months have begun to appear.”
2020 Parallel: The Federal Reserve has kept interest rates low since the Global Financial Crisis and have pledged to keep them at near-zero for as long as is required.
- Move to protect jobs. Hoover obtained assurances from business and labor leaders to protect wages and jobs over protecting profits. “All of these efforts have one end—to assure employment and to remove the fear of unemployment.”
2020 Parallel: The Payroll Protection Program is also designed to keep people employed and to keep wages intact.
- Accelerate construction, building, and maintenance to take up the slack of any jobs lost. A backlog of business activity was “pent-up” and could be unleashed.
“Much construction work had been postponed during the past few months by reason of the shortage of mortgage money due to the diversion of capital to speculative purposes, which should soon be released…[and] will be able to build up the construction and maintenance activities for 1930 to a higher level than that of 1929.”
2020 Parallel: Today, markets continue to hold out hope that all will return to normal and that business activity is just waiting to resume once COVID-19 is addressed and America gets back to work. However, we must assess what economic potential has been permanently lost versus temporarily lost.
- The coordination and cooperation of business and community rather than market forces would overcome the crisis.
“You represent the business of the United States, undertaking through your own voluntary action to contribute something very definite to the advancement of stability and progress in economic life. This is a far cry from the arbitrary dog-eat-dog attitude of the business world some 30 or 40 years ago. And this is not dictation or interference by Government with business. It is request from the Government that you cooperate in prudent measures to solve a national problem.”
2020 Parallel: The shutdown in economic activity, for better or for worse, has been done in the name of cooperation and sacrifice for the greater good of society.
The Response of the Federal Reserve
The actions taken by the Fed then and now merit its own discussion and analysis. The St. Louis Federal Reserve has compiled three hundred years of balance sheet data of the Bank of England. The study has also overlaid the balance sheet data to show it as a percent of GDP. Where data is available, the study also includes data from our Federal Reserve to show how closely the Bank of England and the Federal Reserve mirror their policies and actions.
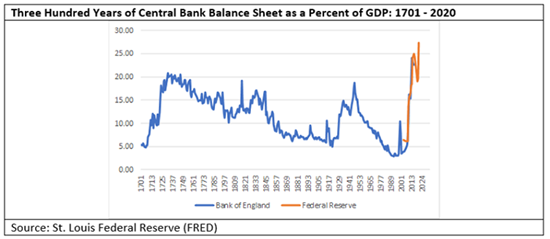
As we can observe, two prior moments in history have called for significant monetary stimulus, the early 1700s and the Great Depression. The response taken by the Fed during the 2008 Global Financial Crisis has surpassed the other two elevated periods. Furthermore, the Fed has now embarked on additional action and the balance sheet is now at an all-time high.
In 2007, the Fed’s balance sheet stood at about 5% of GDP. In response to the Global Financial Crisis, the balance sheet peaked in 2016 at 25% of GDP. You read that right. The balance sheet peaked in 2016, not in the midst of the 2008 crisis, but during one of the greatest bull-markets of all time. Previously, the Fed’s balance sheet had peaked in 1947 in response to the Great Depression and WWII!!! The Fed’s response does beggar the question – are we really that fragile?
From 1947 to 2000, the stock market gained nearly 8.8% annually all the while the Fed’s balance sheet was unwound. From December 2008 to December 2019, the stock market has returned nearly 12.3% annually, but with the balance sheet moving from roughly 5% of GDP to the previously mentioned 25% of GDP.
With the Fed now looking to keep interest rates near-zero for the foreseeable future, we may expect the balance sheet to continue its record expansion. If we assume the response to today’s economic set-back is similar to that of the Global Financial Crisis, then we should anticipate a balance sheet that is 40% of GDP by 2028. That analysis also assumes no other economic challenge befalls us.
In 1929, the balance sheet expansion came in response to falling markets and waning economic conditions. In 2008, the balance sheet expanded appropriately. However, to continue to expand the balance sheet in-line with rising stock markets, well into the recovery, and now with a new surge to come that is all but certain, gives us a taste of what it’s like to have heroin for breakfast. We are monetary addicts.
The policy actions of the Fed and of government are said to protect jobs and undergird economic well-being. In reality, the policies are a perversion. These policies allow the owners of enterprise to reap the reward while socializing the losses. Such policies are not capitalistic nor respectful of free markets. To interfere on behalf of the wealthy while increasing the debt on the public is the worst kind of serfdom. The wealth gap continues to increase as government encroaches on free markets.
As counterpoint to the above, one may argue the Fed’s actions are entirely appropriate and beneficial to markets. From 1928 to 1947, the Fed (using the Bank of England as proxy) increased its balance sheet from 6.73% of GDP to 18.82% of GDP. The S&P 500 declined -37% over that same period. Those of the Bernanke school of thought claim the Fed should have done more in 1929. Indeed, the balance sheet only increased from 6.73% of GDP in 1928 to 11.93% by the end of 1929. The balance sheet remained roughly unchanged through the 1930s even as the economy continued to languish. By 1938, when the market finally hit is peak drawdown in excess of -80%, the balance sheet only stood at 13.46% of GDP.
In 1998, the balance sheet (also using the Bank of England as proxy) stood at 3.48% of GDP. By the end of 2002, after having passed through the emerging market debt crisis, Long Term Capital Management, the bursting of the Dotcom bubble, Nine-Eleven, and the accounting crisis of 2002, the balance sheet only stood at 3.69% of GDP. Over that time period, the S&P 500 had declined -28%.
In contrast to the approach of prior Fed policy-makers, the underlying approach of the last few Fed boards has been markedly different. In 2007, the Fed’s (using the Federal Reserve Balance Sheet) balance sheet was 6.08% of GDP. In 2019, the balance sheet stood at 19% of GDP. The S&P 500 has grown by over 120% over the same period. Therefore, it would seem a more aggressive Fed is favorable for markets. Finally, a balance sheet that continues to expand toward 40% of GDP by 2028 may well overwhelm bears and force markets higher. Only time will tell.
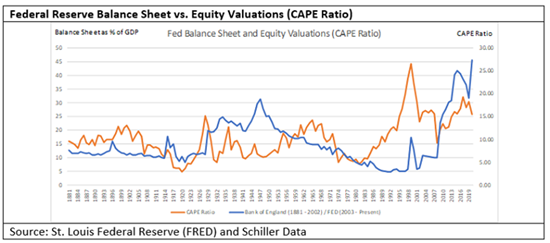
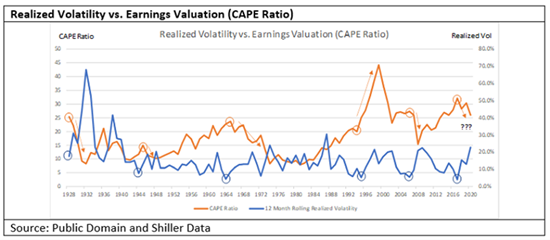
As a rebuttal to the above counterpoint argument that an expanding central bank balance sheet will propel markets, one must assume, however, the Fed’s actions can defy valuations. In 1928, the CAPE Ratio stood at 25.3x earnings. By the end of 1929, the CAPE had declined to 22.0x, to 15.7x by 1938, and to 10.7x by 1947.
In 1998, the CAPE registered 38.8x earnings and 23.1x by the end of 2002.
In the latest expansion, the CAPE ratio peaked again 26.0x in 2007 and bottomed to 15.4x by the end of 2008. The current Fed-fueled market has driven valuations to its second highest levels ever to 30.3x at the end of 2019. Even with this first round of selling, the CAPE ratio stands at a still-elevated 25.9x.
History does not bode well for equity valuations to stay at these current levels, no matter what the Fed does.
One last observation that may be helpful is how valuations relate to the volatility cycle. As one can observe in the below chart, the CAPE ratio most always (Dotcom bubble being the notable exception) experiences a relative peak when realized volatility has made a relative trough. One could make the case the cycle in volatility dictates forward movement in equity valuations. Therefore, regardless of the Fed’s actions, valuations and volatility are likely to continue their inverse movement pattern as both data sets traverse well-established ranges. Not including the Dotcom Bubble, the CAPE has declined to 10-15x following a notable bottom in realized volatility. The troughs in the CAPE ratio have occurred anywhere from one to 10 years following the trough in realized volatility, regardless of Fed policy.
Response in Trade
In 1922, congress enacted the Fordney-McCumber Act to combat falling agriculture prices and to stimulate domestic demand. In 1930, congress passed the infamous Smoot-Hawley Tariff Act. These legislations attempted to help farmers combat lower prices from new European supply through tariffs. The trade war that ensued exacerbated the trade balances and prices. Ultimately, the focus was to assist the US farmer and to produce goods at home.
Since 2016, America has formed bi-partisan support to reduce its reliance on foreign powers which have and continue to show a penchant to either harm, interfere with, or dominate the US. Among the trends in place is a desire for America to produce its own energy and to promote a greater manufacturing base at home.
Since COVID-19, bi-partisan support exists to expand the list of items which should be produced at home, especially healthcare equipment and pharmaceuticals. The trend to retrench critical industries within our own borders harkens back to similar sentiment which prevailed during the Great Depression.
Market Reaction Comparison
We next analyze the responses of the stock market (S&P 500). Below we show 250 trade days of the two market crashes. We start the comparison by using February 19, 2020, the last market high, as the start date. On March 23, 2020, or 22 days later, the market made a bottom. To compare this plunge with the plunge in 1929, we select the dates from 1929 on which the market made its initial bottom and walk the data set back 22 days to align with the 2020 timeline. We then walk both data sets forward for the full 250 days. We have included the equivalent data set for the Great Recession (2008 Global Financial Crisis) for comparison.
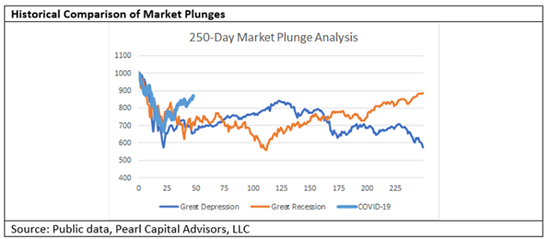
As we can observe, the plunge portion of the sell-off exhibits very similar characteristics in terms of magnitude and steepness. In today’s case, the rebound off the low is sharper than either the Great Depression or Great Recession cases.
In both historical cases, the markets went on to make a new low. In the case of the Great Recession, it came some 80 days later. In the case of the Great Depression, new lows came nearly a year later and continued to make several additional new lows thereafter.
This analysis is useful because it confirms the aggregate market opinion believes the economic, health, trade, and political forces in 2020 are severe enough to signal a significant economic decline. What is also concerning is the market likely anticipated the Fed would respond in the manner that it has–swift and comprehensive. Despite that anticipation, the market still showed a level of concern that economic conditions would be difficult to address.
Another way to compare the two periods is by analyzing the underlying volatility patterns the market exhibited. Using the same alignment methodology as above, below we show the 10-Day realized volatility of the S&P 500.
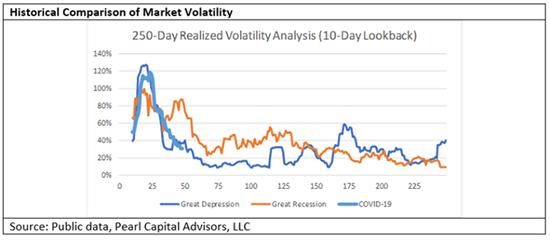
As seen above, the market volatility pattern of the plunge from COVID-19 rivaled the volatility pattern exhibited during the plunge of Great Depression and surpassed the volatility of the Great Recession. Other periods such as the Dotcom bust do not come close to any of the above levels of volatility. Only the ’87 Crash matches the volatility seen during the Great Depression and COVID-19.
Again, the market clearly believes the ingredients of the prelude of our current situation have the potential to infect the larger economy on a grand scale.
In reality, if markets were to go on to make new highs in the short-term, such an outcome would be the exception, not the rule. When the market exhibits this kind of volatility, the first bottom is not the last. When the Fed increases its balance sheet, just as it has so again, the first market bottom is not the eventual market bottom.
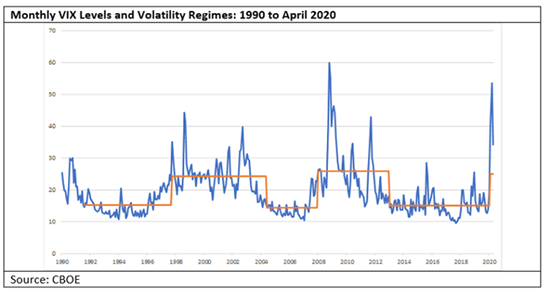
Lastly, as we have discussed in earlier papers, we conclude volatility has entered a new regime in which it will fluctuate around a higher average, as is the norm in such regimes. Therefore, investors should prepare themselves for such market conditions.
Political Fallout
Perhaps at no other time in world history did so much evil come to power at the same time as it did during the 1930s. The atrocities and blood that cries from the ground still echoes in our ears today. From Nazi Germany to Imperial Japan and from Stalin’s Russia to Mao’s China, human suffering was at an all-time high. The leaders of these countries all came to power at or around the time of the Great Depression. It was the era of the Ideological Authoritarian and they answered the agelong question – “What would you do with ultimate power?”
While the US and other parts of the Western world did not give way to such authoritarianism, it did trade liberties for security. The New Deal brought sweeping changes and radical responses unthinkable in earlier days.
Today, the world also faces authoritarians who seek ultimate power. Today, previously unthinkable prescriptions to our health and safety include greater surveillance and control in the name of addressing the causes of our current peril.
When people are in pain and they want a solution, society can demand it or an authoritarian can seize it. Whether the shift in economies and responses upend global power structures in a way that causes human suffering or human advancement remains to be seen. But one thing is for certain, history shows we are vulnerable to potentially radical political change if the economic landscape becomes untethered.
A Prolonged Recovery
We maintain the market should look past COVID-19 and toward our world post the “shelter-in-place” mandates. Even if all states opened tomorrow, the economy would not come back at full capacity. Far from it.
- Wages are under pressure. Our sources confirm that some companies are compelling unpaid leave for a portion of the next quarter.
- Travel will be a fraction of what it was. Due to social distancing, businesses will hold in-person meetings infrequently. There will also be a reduction in leisure travel until confidence is restored.
- Restaurants will continue to suffer as companies grapple with social distancing and fewer workers commuting means fewer customers.
- Energy demand will continue to remain low. With less travel and commuting, oil prices should continue to stay low and continue to pressure a vulnerable energy sector.
- Jobs will be lost. As corporations retrench, especially in the energy sector, workforces will be reduced.
- Overall cutbacks are well underway. In our discussions with industry leaders, the tone is very much about reducing costs in the face of uncertainty.
- Debt defaults are set to grow. Our sources confirm that banks are increasing staff to deal with bad debt.
Given the above, it is unlikely markets will simply move on to new highs in the short term.
Conclusion and Action
America faces similar factors and trends today that were in play in the prelude, response, and fallout of the Great Depression. While we are not claiming America is headed for another depression, the similarities cannot be ignored.
The current rally in the market is based on the hope and faith in the Fed’s ability to backstop any financial distress. The rally is the manifest hope that expanding balance sheets and bailouts will cure injured economies. History suggests despite the Fed’s balance sheet expansions in 1929 and bailouts in 2008, the first market bottom is not the last.
Furthermore, the level of volatility we have recently experienced also suggests the low is not in yet. Volatility calmed following the initial plunge in 1929, but it later returned. The stimulus in 2008 and beyond did not temper volatility. Volatility stayed elevated through 2012. Additionally, we conclude volatility officially transitioned to the higher portion of its cycle at the end of February 2020. Given the transition, our analysis suggests we should expect volatility to remain above average for at least the next 2-5 years.
The economy will not return to full capacity after “shelter-in-place” orders are lifted. Investors should look past COVID-19 and focus their analysis on the new condition of the economy. Our analysis and discussions with industry leaders point to a diminished global economy for the foreseeable future. Such a limitation to economic activity also suggests the market will be hard-pressed to make a new high in the short term.
Even if all of the above analysis is incorrect and we do go on to make new market highs in the short term, we do believe volatility will remain generally elevated as we have stated. Therefore, it is our opinion that market participants would do well to examine their current allocations and exposures and consider the impact of higher volatility, the potential for additional lows in markets, and the fallout of reduced economic activity would have on their portfolio. We urge institutions and investors to connect with Pearl to discuss solutions to what may lie ahead.
**********
Timothy R. Jacobson, CFA and Lawson E. Stringer are Managing Partners at Pearl Capital Advisors
***
The views expressed in this article are those of the author and do not necessarily reflect the views of AlphaWeek or its publisher, The Sortino Group
© The Sortino Group Ltd
All Rights Reserved. No part of this publication may be reproduced, stored in a retrieval system or transmitted in any form or by any means, electronic, mechanical, photocopying, recording or scanning or otherwise, except under the terms of the Copyright, Designs and Patents Act 1988 or under the terms of a licence issued by the Copyright Licensing Agency or other Reprographic Rights Organisation, without the written permission of the publisher. For more information about reprints from AlphaWeek, click here.