
Equity Long Short Provides Portfolio Protection – Truth or Myth?
Equity Long Short (ELS) is the poster child of hedge fund strategies. The innovative 130/30 strategy took the hedge fund universe by storm in the 2000’s, providing outsized returns and, consequently, calls for allocations. It’s still one of the top hedge fund strategies in terms of supply, but is it holding up to its historical reputation and what investors look for from an ELS allocation?
In my view, the goal of an alternative investment product is to diversify an investor’s portfolio without having to give up significant portfolio return expectation. In nearly all of my research efforts, my goal is to uncover the ‘hidden beta’ behind the alternative investment product to gauge whether it really is providing the portfolio diversification I require when market stress comes to the forefront. With ELS products, managers are not even hiding the beta as we know that they have a gross long exposure to the equity markets…and usually a significant one.
With the above in mind, there must be something pretty special in the portion of the returns that we know are not aligned with what the market is doing. Is this portion of returns providing the diversification and alpha required by investors that make paying fees not only on the portion that is bringing the alpha and diversification magic but also on the portion that is aligned with the market justifiable?
In this note, we look at what is driving ELS returns to analyse its alpha and portfolio diversification performance versus cheaper counterparts to ultimately back-up - or tear-down - the commonly held investor belief that they should have an allocation to ELS strategies due to their portfolio protection characteristics.
What is Driving Equity Long Short Returns?
It is no surprise that hedge fund managers want gross long exposure to equity markets given their long-term increasing nature – all we need to do is look at the long-term chart of the S&P 500 to see why. ELS managers have a wide range of gross exposures they can take and so it comes as no surprise that we witness a strong correlation between ELS returns and the S&P 500’s return as shown in Figure 1 below. We used the BarclayHedge Equity Long Short Index1 to represent ELS fund performance for our analysis.
Figure 1: S&P 500 vs Equity Long Short Index
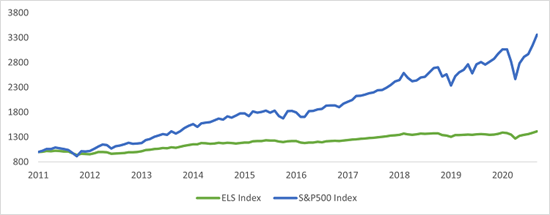
Source: Athlon Family Office, BarclayHedge
As we expect a significant amount of the return to be driven by the market, we strip out the portion of ELS returns that is being driven by just that. We do this for two reasons:
- we know this significant return driver, and
- we can get this exposure cheaper in an ETF, so we need to see what else ELS returns are providing us for the extra fees we pay.
We use a two-step regression to analyse returns; first, we run a regression against the S&P 500 to find the residual return stream which represents the ELS returns minus the portion driven by the S&P 500 [ELS ex-market], and second, we then take the ELS ex-market return stream and run a multi-variable regression against a proprietary dataset of the most common equity factors to find the ELS ex-market & equity factor performance.
The results are sobering for ELS managers and investors. We expect market returns to be a large component of ELS returns but investors do not expect market returns to have driven more than 100% of ELS’ positive performance as shown below in Figure 2. We also see that ELS returns are driven, to a degree, by equity factors which do provide a positive performance to the funds’ returns – however, not enough to make up for the losses incurred after market-driven returns are stripped out.
Figure 2: Equity Long Short Stripped of Market and Equity Factor Risk
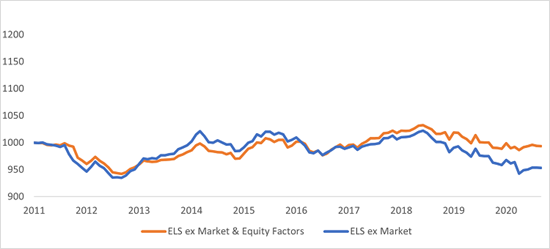
Source: Athlon Family Office
To get a sense of the factor-driven performance of ELS funds, we calculate the coefficients of the common factors to their returns. As we know that ELS managers have a long bias, we expect a significant dependency on the market factor. We can see in Figure 3 below that the market is the most significant component to returns - which should not surprise us, given the results from the charts above.
Figure 3: Equity Long Short Factor Breakdown
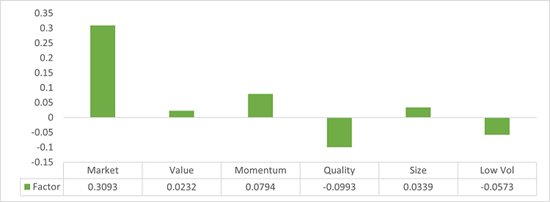
Source: Athlon Family Office
Diversification / Market Protection
Portfolio protection is best accomplished by adding return streams that have fundamentally different drivers than those driving the current portfolio’s performance. Adding a return stream that has a correlation of 0% - or even better, a return stream that has a high negative correlation to the main portfolio component - will mean the portfolio delivers reduced drawdowns in bad times because a bad time in the main portfolio does not mean a corresponding bad time within an uncorrelated return stream. If, however, the portfolio protection return is driven by the same drivers as those in the main portfolio, a bad time in the main portfolio will also mean a bad time for the portfolio protection allocation.
I have heard numerous times that investors believe that ELS funds will provide them equity downside protection due to the manager’s ability to go short/sell. To me, this is a marketing gimmick that stands true in theory as they can sell during market drops, however, real-world execution of this concept is difficult. As no-one knows when markets will crash, a manager must already be net short to profit off initial market drops. That requires the manager to be structurally net short on any given day when we know that ELS managers are structurally net long on any given day. We should theoretically expect any ELS manager to have dampened, with similar direction, losses during periods of equity market volatility if they run a net exposure greater than 0%; we should expect an ELS return to be a ‘diversifier’ if their net exposure on any given day is close to 0%; and we should expect an ELS return to be a ‘hedge’ if the manager has a net short position on any given day.
The execution difficulty is that managers want to be net long the market due to its long-term increasing nature. To test whether ELS returns do provide that coveted hedge or diversification benefit that managers says it does, we created a portfolio that consists only of the months where the S&P 500 had a negative return. We analysed how the BarclayHedge ELS Index performed during those months and compared that against how traditional portfolio protection investments like Bonds and Gold behaved during those months.
Unsurprisingly, as most ELS funds have a net long position on an average day, the ELS Index has a high correlation with the S&P 500 during the months where the S&P 500 had a losing month. The traditional hedges/safe havens showed an expected negative correlation during those same months, as shown in Table 1 below; we use gold futures prices (Ticker: ‘GC=F’) and the 7-10-year US Bond ETF (Ticker: ‘IEF’) as our instruments for this analysis.
Table 1: Correlation Matrix During Negative S&P 500 Monthly Returns
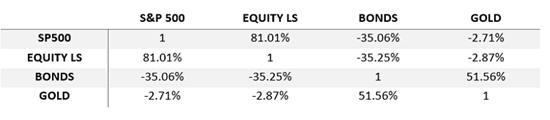
Source: Athlon Family Office
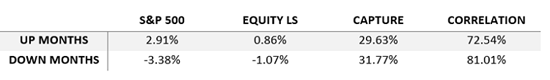
We then analysed ELS’s up-capture and down-capture by analysing an ‘up portfolio’ and ‘down portfolio’ which consists only of the months the S&P 500 was positive and negative, respectively. Table 2 below shows that although both portfolios deliver similar levels of capture, the up capture is lower than the down capture and the correlation on the up months is lower than the correlation on the down months; neither of which are desirable for investors.
Table 2: Up Capture & Down Capture Analysis
Source: Athlon Family Office
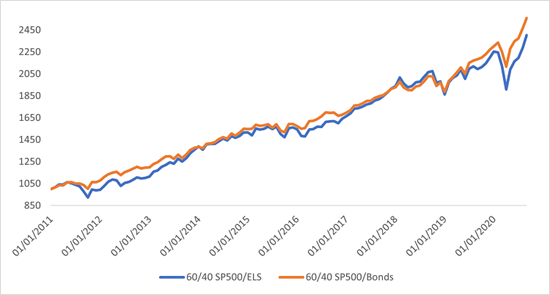
We further test ELS’s protection characteristic by creating a blended portfolio comparing the inclusion of the ELS Index versus the traditional portfolio diversifier of Bonds to analyse both drawdown protection and return expectancy.
We created two portfolios using the traditional 60/40 mix for this analysis:
- 60% S&P 500 – 40% ELS Index, and
- 60% S&P 500 – 40% Bonds.
What may not be surprising is that the S&P 500 + Bond portfolio has reduced drawdowns over the lifetime versus its peer, but what may be surprising to many is that the S&P 500 + Bond portfolio also outperformed its S&P 500 + ELS peer on an absolute return basis, as shown in Figure 4.
Figure 4: 60/40 Portfolio Comparison
Source: Athlon Family Office
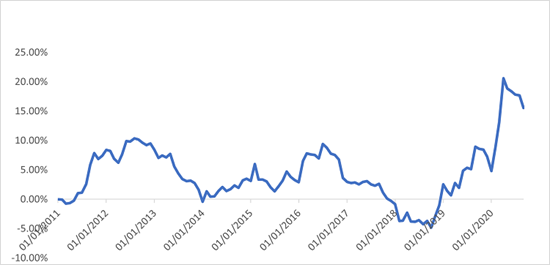
Figure 5 below looks at the drawdown difference during the life of the analysis between the two 60/40 portfolios. By investing in the S&P 500 + Bond portfolio instead of the S&P 500 + ELS portfolio, we save on average 4.56% of a loss during a drawdown. During the volatility witnessed as a result of the implementations of lockdowns at the beginning of the Covid-19 pandemic in February and March 2020, we would have saved 20.59% of the S&P 500 drawdown.
Figure 5: 60/40 Portfolio Drawdown Saving
Source: Athlon Family Office
Equity Long Short Index Replication
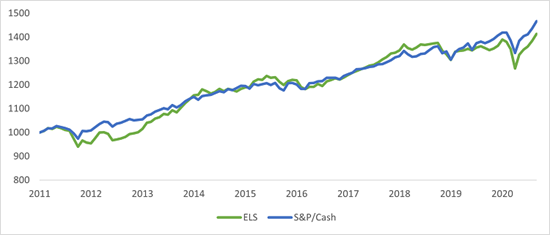
In this section we seek to replicate ELS returns via cheaper investment vehicles to determine whether paying the increased fees are justifiable from a return and return behaviour perspective. When analysing ELS Index returns versus a simple portfolio of 30% S&P 500 + 70% cash, not only do we get a portfolio with a 98% correlation to the ELS Index, but we also get a portfolio that outperforms its counterpart over the time period of the analysis.
Figure 6: ELS vs 30/70 S&P 500/Cash
Source: Athlon Family Office
Conclusion and Further Thoughts
Critics of this research will point out that we have used an ELS Index, or average, of returns. Within this index’s universe, there will be outperformers and underperformers; indeed, the hedge fund industry is famous for the broad range of dispersion amongst fund returns. Indices also bring a natural level of survivorship bias, which tends to overexaggerate the long-term returns from the Index. This research, however, can be used to analyse individual funds instead of an average or index level return profile and can be further boosted by using daily data to analysis ELS performance during market volatility instead of monthly data which was used within this research note.
Primarily, we set out to analyse whether an allocation to ELS strategies puts forward a strong case for inclusion in a portfolio for portfolio protection reasons. We looked at what drives ELS returns and whether the ELS return profile can be achieved via cheaper investment vehicles and we tested its return characteristics during both negative market movement and positive market movements. We found that ELS returns can be fully explained by S&P 500 returns, we saw that ELS returns can be cheaply and easily replicated through a simple 30% S&P 500 – 70% cash portfolio, we found that ELS returns have a high correlation with the S&P 500 during negative months and we found that a simple, and cheaper, 60/40 S&P 500 / Bond portfolio not only significantly reduces portfolio drawdown but also provides a higher return expectancy versus a 60/40 S&P 500 / ELS portfolio.
**********
Karl Rogers is Co-Founder & Managing Partner of Athlon Family Office
1 https://portal.barclayhedge.com/cgi-bin/indices/displayHfIndex.cgi?indexCat=Barclay-Hedge-Fund-Indices&indexName=Equity-Long-Short-Index
***
The views expressed in this article are those of the author and do not necessarily reflect the views of AlphaWeek or its publisher, The Sortino Group
© The Sortino Group Ltd
All Rights Reserved. No part of this publication may be reproduced, stored in a retrieval system or transmitted in any form or by any means, electronic, mechanical, photocopying, recording or scanning or otherwise, except under the terms of the Copyright, Designs and Patents Act 1988 or under the terms of a licence issued by the Copyright Licensing Agency or other Reprographic Rights Organisation, without the written permission of the publisher. For more information about reprints from AlphaWeek, click here.