


Kettera Strategies Heat Map - February 2024
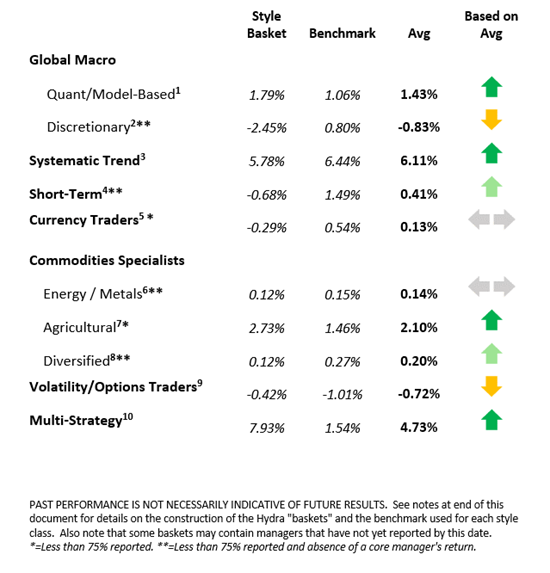
The Style Heat Map below offers a snapshot for the month on all categories of strategies. For the month of February, the following summaries highlight four of the 10 style categories that we track.
Systematic Trend Programs
February was an extremely profitable month for many, if not most, long-term trend programs. While historically the most profitable months are marked by a major crisis event that triggers most markets at once, February was unusually rich in different trends in varied markets - both long and short. The most notable gains were in the agricultural sub-sectors: grains, livestock and softs. Long positions in cocoa positions caught a 35% rally just in February. Short grains (corn, soybeans, and soymeal) were also big winners and common across programs. Other popular winning positions were long global equity indices (US, Europe, Japan), and short the Japanese Yen vs. the USD, Euro and British Pound. The longest-term programs (6-12+ month holding periods) fared the best, while the shortest trend models tended to perform the worst.
Discretionary Global Macro Managers
Discretionary global macro underperformed in February, and the worst sector was fixed income and short-term rates (STIR). Many programs were positioned for a steepening of the yield curve, a spread trade that is structured as short the front end (rates) and long the back end (bonds), an expectation that did not play out. Traders that were directionally long short-term rates (yields fall) in anticipation of rate cuts by the Fed and Europe got whipsawed. Currencies were a mixed bag for the discretionary programs. Many managers came into the month long the Japanese yen in anticipation that the BoJ would move away from NIRP (negative interest rates), which did not happen and the yen weakened against most G10 majors.
Commodities Managers – Agricultural Specialists
Agricultural commodities traders had one of their best months in memory. February saw the continuation of downward price moves in many markets due to ample global supplies in corn, soybeans and soymeal that started last November. This move has been exploited by nearly every type of program. Spread traders (short-biased), directional programs, and options traders have seemed to all cash in on this trend, regardless of systematic vs discretionary approach. Even though the downward trend is long lived, many fundamental traders see more room to fall. That said, this has become quite a crowded trade and any disruption to the oversupplied narrative, such as a bad stretch of weather, could see a sharp correction upwards.
Commodities Managers – Industrial Commodities Specialists (energies & metals)
Industrial commodities were mixed, with some energy programs doing well while metals programs generally underperformed. In energy, the better-performing systematic spread and discretionary energy-focused programs tended to be short natural gas and/or European energy markets. Small profits were also captured by long positions in crude oil, but refined products (distillates, gasoline, heating oil, diesel, crack spreads) proved difficult. In metals, most of the fundamental discretionary programs that we track underperformed. Losses seemed to be most frequent in long copper (for the first half of the month) and long gold exposures (the entire month). (Those managers that held on to or reinstated these long positions have been rewarded in March MTD.) We’re still curious why most of the metals managers we track did not benefit a great deal from long nickel (up 10%) or short platinum (down 5%) in February.
**********
Footnotes:
For the “style classes” and “baskets” presented in this letter: The “style baskets” referenced above were created by Kettera for research purposes to track the category and are classifications drawn by Kettera Strategies in their review of programs on and for the Hydra Platform. The arrows represent the style basket’s overall performance for the month (e.g. the sideways arrow indicates that the basket was largely flat overall, a solid red down arrow indicates the basket (on average) was largely negative compared to most months, etc.). The “style basket” for a class is created from monthly returns (net of fees) of programs that are either: programs currently or formerly on Hydra; or under review with an expectation of being added to Hydra. The weighting of a program in a basket depends upon into which of these three groups the program falls. Style baskets are not investible products or index products being offered to investors. They are meant purely for analysis and comparison purposes. These also were not created to stimulate interest in any underlying or associated program. Nonetheless, as these research tools may be regarded to be “hypothetical” combinations of managers, hypothetical performance results have many inherent limitations, some of which are described below. no representation is being made that any product or account will achieve profits or losses similar to those shown. in fact, there are frequently sharp differences between hypothetical performance results and the actual results subsequently achieved by any particular trading program. one of the limitations of hypothetical results is that they are generally prepared with the benefit of hindsight. in addition, hypothetical trading does not involve financial risk, and no hypothetical trading record can completely account for the impact of financial risk in actual trading. there are numerous other factors related to the markets in general or to the implementation of any specific trading program which cannot be fully accounted for in the preparation of hypothetical performance results and all of which can adversely affect actual trading results..
Benchmark sources:
- Blend of Eurekahedge Macro Hedge Fund Index and BarclayHedge Global Macro Index
- The Eurekahedge Macro Index
- The Société Générale Trend CTA Index
- The Société Générale Short-term Traders Index
- The Barclay Hedge Currency Traders Index
- Blend of Bridge Alternatives Commodity Hedge Fund Index and Barclay Discretionary Traders Index (for February only the Barclay index was used as the Bridge index was unavailable.)
- The Barclay Agricultural Traders Index: (same link as above)
- The Eurekahedge Commodity Hedge Fund Index
- Blend of CBOE Eurekahedge Relative Value Volatility Hedge Fund Index and CBOE Eurekahedge Long Volatility Index (same link)
- Blend of Eurekahedge Multi Strategy Asset Weighted Index and Barclay Hedge Fund Multi Strategy Index
Indices and other financial benchmarks shown are provided for illustrative purposes only, are unmanaged, reflect reinvestment of income and dividends and do not reflect the impact of advisory fees. index data is reported as of date of publication and may be a month-to-date estimate if all underlying components have not yet reported. the index providers may update their reported performance from time to time. Kettera disclaims any obligation to verify these numbers or to update or revise the performance numbers.
***
The views expressed in this article are those of the author and do not necessarily reflect the views of AlphaWeek or its publisher, The Sortino Group
© The Sortino Group Ltd
All Rights Reserved. No part of this publication may be reproduced, stored in a retrieval system or transmitted in any form or by any means, electronic, mechanical, photocopying, recording or scanning or otherwise, except under the terms of the Copyright, Designs and Patents Act 1988 or under the terms of a licence issued by the Copyright Licensing Agency or other Reprographic Rights Organisation, without the written permission of the publisher. For more information about reprints from AlphaWeek, click here.