

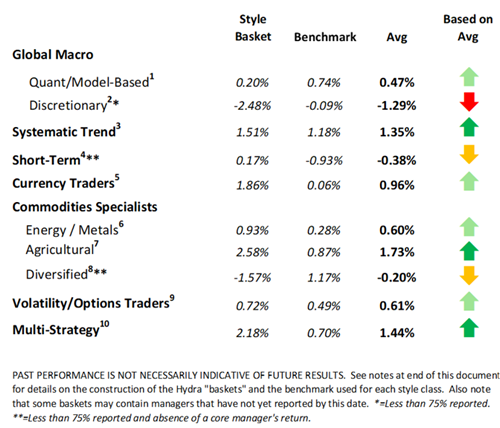
Kettera Strategies Heat Map - January 2024
The Style Heat Map below offers a snapshot for the month on all categories of strategies. For the month of January the following summaries address four of the 10 style categories that we track.
FX Specialists
FX programs were all over the map last month. The consensus view by traders of US dollar weakness coming into January turned out to be misguided. Many programs were caught by surprise as sentiment quickly flipped from bearish USD to bullish after the US economy’s unexpectedly strong employment data in early January sparked optimism for the USD (which rose roughly over 2% during the month). Some of the better performing positions were long USD and short just about any G10 or Nordic currency. In cross-rates, long Swedish Krona-short Euro was a winner in the second half of the month. Most of the FX strategies that Kettera tracks outperformed the industry FX manager benchmarks – largely because fundamentals-based programs tended to fare better than more technical and shorter-term strategies.
Discretionary Global Macro Managers
Most of the discretionary global macro programs that Kettera follows slightly underperformed the broader benchmark, as the reversal in the US dollar, from weak to strong, caught managers off-guard with currencies finishing the month generally the worst performing sector. There also appeared to be little overall contribution from commodities, equities or fixed income, although a few programs had idiosyncratic exposures in long equities, long base metals, and long crude that were helpful. In fixed income and short-term rates, many global macro programs appear to be holding a 2/10 yield curve steepener (short the 2-Years, long the 10-Years) in anticipation of a soft landing and the normalization of interest rate spreads.
Commodities – Agricultural Specialists
Corn, bean and wheat were all under pressure throughout January. Fortunately, many of the grains programs Kettera lists or tracks had short exposures, primarily in corn and beans, through the use of short-biased spreads and/or options strategies. Underlying fundamentals have been pointing to increasing supplies and slowing global demand growth. Most traders interpret the overall forward price trend in corn and beans to be pointing downward, but sudden changes in weather and growing conditions can always make the intermediate price path choppy. A few programs also traded livestock successfully, with bullish exposures to the cattle market. Cattle inventories are currently limited, most notably a lack of females (cows), and is expected to continue to be so going forward, pushing prices higher, with tight supplies expected for the next two years.
Systematic Trend CTAs
Long term trend followers, both those included in our universe as well as the industry in general, were generally positive in January. Profitable returns were found largely in commodities and equities – which were only partially offset by mixed to negative performance in positions in the FX and fixed income sectors. Notable contributors in the commodities sector were long cocoa, short grains such as corn and soybeans, and long crude oil. In the equities sector, the bulk of profits came from long exposures to US and Japanese stock indices and short Chinese indices. Currencies were mixed as some programs came into January long USD versus most G10 units, which reversed sharply after a strong employment report early in the month. Most programs were negative in fixed income positions to varying degrees, the worst off being those with long exposures to various European debt instruments as yields rose (and the price of these instruments dropped).
**********
Footnotes:
For the “style classes” and “baskets” presented in this letter: The “style baskets” referenced above were created by Kettera for research purposes to track the category and are classifications drawn by Kettera Strategies in their review of programs on and for the Hydra Platform. The arrows represent the style basket’s overall performance for the month (e.g. the sideways arrow indicates that the basket was largely flat overall, a solid red down arrow indicates the basket (on average) was largely negative compared to most months, etc.). The “style basket” for a class is created from monthly returns (net of fees) of programs that are either: programs currently or formerly on Hydra; or under review with an expectation of being added to Hydra. The weighting of a program in a basket depends upon into which of these three groups the program falls. Style baskets are not investible products or index products being offered to investors. They are meant purely for analysis and comparison purposes. These also were not created to stimulate interest in any underlying or associated program. Nonetheless, as these research tools may be regarded to be “hypothetical” combinations of managers, hypothetical performance results have many inherent limitations, some of which are described below. no representation is being made that any product or account will achieve profits or losses similar to those shown. in fact, there are frequently sharp differences between hypothetical performance results and the actual results subsequently achieved by any particular trading program. one of the limitations of hypothetical results is that they are generally prepared with the benefit of hindsight. in addition, hypothetical trading does not involve financial risk, and no hypothetical trading record can completely account for the impact of financial risk in actual trading. there are numerous other factors related to the markets in general or to the implementation of any specific trading program which cannot be fully accounted for in the preparation of hypothetical performance results and all of which can adversely affect actual trading results.
Benchmark sources:
- Blend of Eurekahedge Macro Hedge Fund Index and BarclayHedge Global Macro Index
- The Eurekahedge Macro Index: (same link as above)
- The Societe Generale Trend CTA Index
- The Societe Generale Short-term Traders Index: (same link as above)
- The BarclayHedge Currency Traders Index
- Blend of Bridge Alternatives Commodity Hedge Fund Index and Barclay Discretionary Traders Index
- The Barclay Agricultural Traders Index: (same link as above)
- The Eurekahedge Commodity Hedge Fund Index:
- Blend of CBOE Eurekahedge Relative Value Volatility Hedge Fund Index and CBOE Eurekahedge Long Volatility Index (same link):
- Blend of Eurekahedge Asset Weighted Multi Strategy Asset Weighted Index (same link as above) and Barclay Hedge Fund Multi Strategy Index.
Indices and other financial benchmarks shown are provided for illustrative purposes only, are unmanaged, reflect reinvestment of income and dividends and do not reflect the impact of advisory fees. index data is reported as of date of publication and may be a month-to-date estimate if all underlying components have not yet reported. the index providers may update their reported performance from time to time. Kettera disclaims any obligation to verify these numbers or to update or revise the performance numbers.
***
The views expressed in this article are those of the author and do not necessarily reflect the views of AlphaWeek or its publisher, The Sortino Group
© The Sortino Group Ltd
All Rights Reserved. No part of this publication may be reproduced, stored in a retrieval system or transmitted in any form or by any means, electronic, mechanical, photocopying, recording or scanning or otherwise, except under the terms of the Copyright, Designs and Patents Act 1988 or under the terms of a licence issued by the Copyright Licensing Agency or other Reprographic Rights Organisation, without the written permission of the publisher. For more information about reprints from AlphaWeek, click here.