

Kettera Strategies Heat Map - March 2024
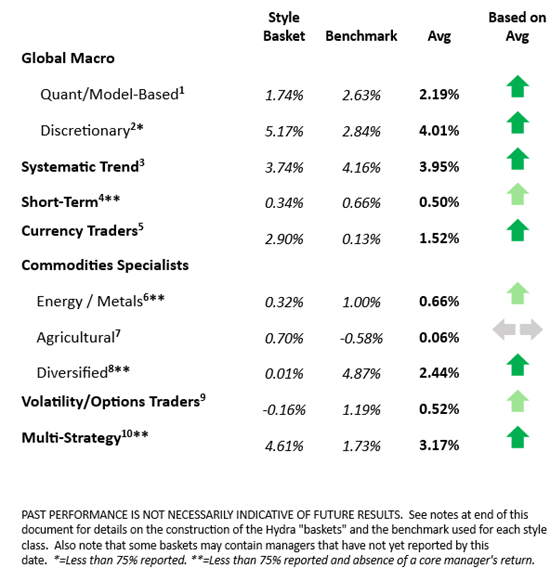
The Style Heat Map below offers a snapshot for the month on all categories of strategies. For the month of March, the following summaries highlight four the 10 style categories that we track.
Systematic Trend Programs
Long-term systematic trend followers had a profitable March with several notable “risk-on” market trends driving performance. For many programs, long global equity indices was the strongest sector, as several G10 global indices hit new all-time highs mid-month. Trend systems also fared well in commodities markets, with a net-positive mixture across most sub-sectors. Long oil and products (crude, unleaded gas, gasoil), long precious metals (gold, silver), long copper, and long softs (cocoa, coffee) were successful trades, while short grains (soybeans, soymeal, corn) was unsuccessful as grains rallied throughout the month. Short Japanese Yen (vs. USD, Euro, British Pound) was another strong performer. The longer-term trend programs (6-12+ months) outperformed the shorter and medium-term (3 weeks – 3 months) programs, although all appeared to be generally positive in March.
Discretionary Global Macro
Discretionary global macro programs were mostly positive in March, with a couple of concentrated programs outperforming on long precious and base metals exposures (silver, gold, copper), and short Japanese Yen vs. US Dollar-Euro-British Pound. Long global equities was another strong performing sector on the back of AI enthusiasm and a general “risk-on” sentiment. We observed modest performance in fixed income bonds and short-term rates. Those programs that overweighted the steepening yield curve trade were met with setbacks on this trade. (The steepening position involves short the front end (rates), long the back end (bonds) of the yield curve). Tactical concentrated portfolios, especially those that trade commodities, outperformed more broadly diversified programs that are more focused on financial sectors.
FX Specialists
In March the currency markets were either a big frustration or a cash cow depending on one’s strategy. Medium-term systems seemed to catch the right frequency, and longer-term macro-oriented programs (with more fundamental inputs) seemed to navigate the markets well. In the systematic (price-based) camp, however, the “two ends of the spectrum” encountered the most trouble: Short-term programs (holding less than three trading days) and longer-term systematic trend programs (in excess of 15 trading days) found it hard to catch a break in the G10 currencies, each for their own reasons. In addition to a “down, then up” USD during the month, declining volatility also stymied the systematic crowd - in particular shorter-term breakout traders. After the USD sold off in the first week (with traders anticipating a more dovish U.S. Fed), some data releases countered the move and buoyed the US dollar. The mid-month rally was further fueled by the Bank of Japan, which imposed a rate hike – but one the markets viewed as too little too late. On the other hand, carry strategies – which welcome lower volatility - seemed to have performed relatively well in March.
Commodities Specialists - Agricultural
The agricultural sector offered interesting opportunities last month. While most investors think grains and livestock, we were reminded again of the importance of softs markets (cocoa, sugar, coffee, cotton, etc.) Programs mostly focused on the former performed poorly. The prevailing fundamental picture has been bearish with plentiful supplies in S.America and good planting conditions in the US and Europe; but many of these markets surprised traders by rallying in March - on a combination of varied crop planting acreage numbers, weather factors, and conflicting supply estimates. Those programs more heavily allocated to livestock, namely live cattle, fared better since they captured a short-term fundamentally driven sell-off in the latter half of the month. The real winners were the softs markets. Most programs positioned in softs had an outstanding month as they captured a parabolic cocoa market and a strong positive trend in coffee. Cocoa has more than doubled since January 1 on a combination of poor growing conditions and a cocoa plant disease, accelerated by a short squeeze.
**********
Footnotes
For the “style classes” and “baskets” presented in this letter: The “style baskets” referenced above were created by Kettera for research purposes to track the category and are classifications drawn by Kettera Strategies in their review of programs on and for the Hydra Platform. The arrows represent the style basket’s overall performance for the month (e.g. The sideways arrow indicates that the basket was largely flat overall, a solid red down arrow indicates the basket (on average) was largely negative compared to most months, etc.). The “style basket” for a class is created from monthly returns (net of fees) of programs that are either: programs currently or formerly on Hydra; or under review with an expectation of being added to Hydra. The weighting of a program in a basket depends upon into which of these three groups the program falls. Style baskets are not investible products or index products being offered to investors. They are meant purely for analysis and comparison purposes. These also were not created to stimulate interest in any underlying or associated program. Nonetheless, as these research tools may be regarded to be “hypothetical” combinations of managers, hypothetical performance results have many inherent limitations, some of which are described below. No representation is being made that any product or account will achieve profits or losses similar to those shown. In fact, there are frequently sharp differences between hypothetical performance results and the actual results subsequently achieved by any particular trading program. One of the limitations of hypothetical results is that they are generally prepared with the benefit of hindsight. In addition, hypothetical trading does not involve financial risk, and no hypothetical trading record can completely account for the impact of financial risk in actual trading. There are numerous other factors related to the markets in general or to the implementation of any specific trading program which cannot be fully accounted for in the preparation of hypothetical performance results and all of which can adversely affect actual trading results.
Benchmark sources:
- Blend of Eurekahedge Macro Hedge Fund Index and Barclayhedge Global Macro Index
- The Eurekahedge Macro Index: (same link as above)
- The Societe Generale Trend CTA Index
- The Societe Generale Short-term Traders Index: (same link as above)
- The Barclay Hedge Currency Traders Index
- Blend of Bridge Alternatives Commodity Hedge Fund Index and Barclay Discretionary Traders Index
- The Barclay Agricultural Traders Index: (same link as above)
- The Eurekahedge Commodity Hedge Fund Index
- Blend of CBOE Eurekahedge Relative Value Volatility Hedge Fund Index and CBOE Eurekahedge Long Volatility Index:
- Blend of Eurekahedge Asset Weighted Multi Strategy Index and Barclay Hedge Fund Multi Strategy Index
Indices and other financial benchmarks shown are provided for illustrative purposes only, are unmanaged, reflect reinvestment of income and dividends and do not reflect the impact of advisory fees. Index data is reported as of date of publication and may be a month-to-date estimate if all underlying components have not yet reported. The index providers may update their reported performance from time to time. Kettera disclaims any obligation to verify these numbers or to update or revise the performance numbers.
© The Sortino Group Ltd
All Rights Reserved. No part of this publication may be reproduced, stored in a retrieval system or transmitted in any form or by any means, electronic, mechanical, photocopying, recording or scanning or otherwise, except under the terms of the Copyright, Designs and Patents Act 1988 or under the terms of a licence issued by the Copyright Licensing Agency or other Reprographic Rights Organisation, without the written permission of the publisher. For more information about reprints from AlphaWeek, click here.