


How Managed Futures Investing Reduces Portfolio Volatility
Most investors tend to believe that stocks are a good—perhaps even the best—investment in the long run. However, the reason for expecting good performance from stocks is perhaps not always clearly articulated: Quite simply, it is because they are risky. To mitigate risk, investors add bonds into a portfolio. For an 80/20 stock-bond portfolio, 98% of total risk is attributable to stocks, and for a 60/40 portfolio, the contribution is as high as 92%.
Does investing in other non-correlated asset classes affect total portfolio risk and its components? As an example of a non-correlated asset class, we pick managed futures.6 Not knowing how volatile stocks, bonds, and managed futures may be in the future, we make some assumptions, as before, that are based roughly on the values realised during the period 1987-2016.[7]
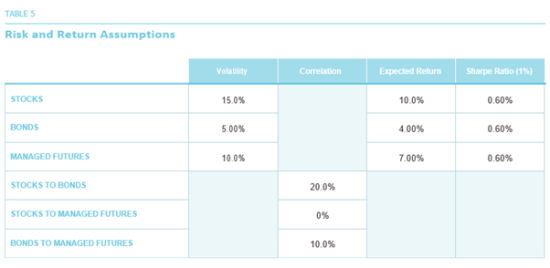
In Table 5, we show the volatilities we assume for stocks, bonds, and managed futures, as well as the assumed correlations between each pair of asset classes. We also make what we believe are some reasonable assumptions about the expected returns on each asset class for the long run: We assume that the risk-free rate of interest will be 1%, and that all three asset classes will have the same Sharpe Ratio going forward.[8]
In Table 6, we show the risk of hypothetical portfolios with a range of allocations to stocks and bonds, with the balance allocated to managed futures, so that the three allocations add up to 100%. Note that the portfolios at the three corners of the triangular array represent portfolios with 100% allocated to a single asset class out of the three (highlighted in yellow). Portfolios along the edges of the triangle represent two-asset portfolios: green are stock/ bond portfolio, pink are stock/managed futures, and blue are bond/managed futures.[9]
Thus, a 50/50 stock/bond portfolio has a risk of 8.4%, a 50/50 stock/managed futures portfolio a risk of 9.0%, and a 50/50 bond/managed futures portfolio a risk of 5.8%. Note that these risks are in each case lower than the simple average of the two individual risks: this is the “free lunch” of diversification.
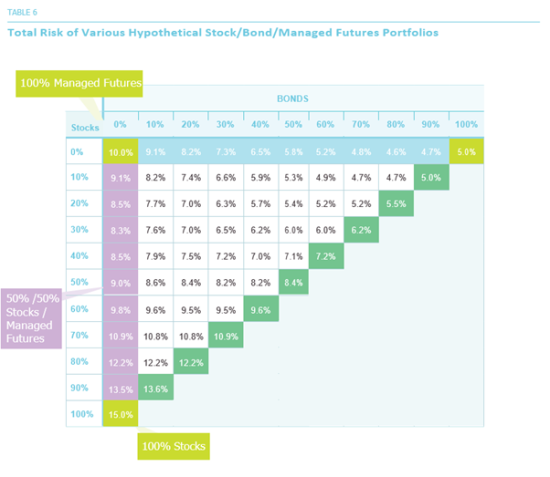
The 50/50 stock/bond portfolio’s risk is 8.4% compared to the average risk of stocks and bonds, which is 10% (the average of 5% and 15%); this represents a 16% reduction in risk. The correlation of stocks and bonds is assumed to be 20% in Table 5. Stocks and managed futures are assumed to have a correlation of zero. The risk of the 50/50 stocks/ managed futures portfolio is 9%, which is 28% lower than their average risk, which is 12.5% (the average of 10% and 15%). This larger reduction in risk, 28% vs. 16%, is a consequence of the lower correlation of 0% vs 20%. How would an investor decide which of these portfolios he/ she prefers? Should it be the portfolio with the lowest risk? That turns out to be the 80/20 bonds/managed futures portfolio, with a risk of 4.6%. However, this is mainly a consequence of the fact that bonds are generally the least risky of the three asset classes. We should also expect this low-risk portfolio to have a fairly low—perhaps the lowest—expected return, possibly too low for an investor who is more aggressive. As we have said before, looking at just portfolio risk without considering return—or looking at return without considering risk—only tells half the story.
Investors, in conjunction with their advisors, need to decide the level of total portfolio risk with which they are comfortable. This will likely be a function of several variables, including age, life-cycle status, wealth, liquidity needs, and attitude towards risk.
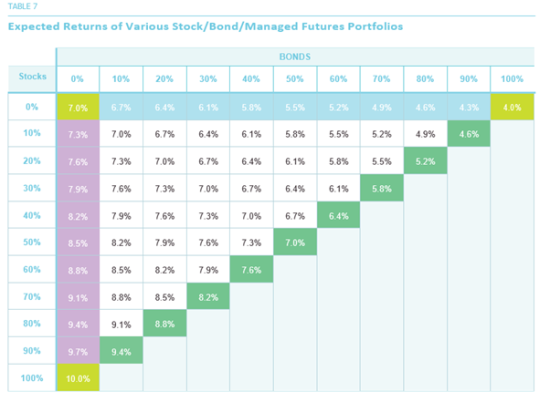
Let us now turn to the expected returns (based on our assumptions from Table 5) of these portfolios, which are shown in Table 7 above. As expected, portfolios with higher stock allocations tend to have higher returns, while those with higher bond allocations tend to have lower returns. Note that the expected return of any 50/50 portfolio is simply the average of the returns for its component asset classes; there is no “diversification” advantage (or disadvantage) for portfolio expected return as there is for portfolio risk. One way to combine the information in Tables 6 and 7 in an effort to seek out an “optimal” portfolio is to calculate the Sharpe Ratio for each portfolio. This ratio is simply a measure of how much “risk premium” a portfolio earns per unit of risk that it takes. To keep things simple, we assume a risk-free rate of 1%, and calculate the Sharpe Ratio for each portfolio:
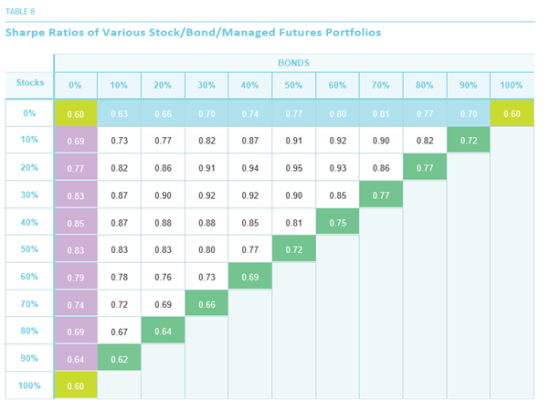
For example, the 50/50 stock/bond portfolio has a Sharpe Ratio equal to 7% minus 1%, which is 6%, divided by its risk of 8.4%, which gives 0.72. All else equal, a higher Sharpe Ratio implies a more desirable portfolio.
In Table 8, we show the Sharpe Ratios for the various portfolios. The “corner” portfolios, with 100% in a single asset class, all have the same Sharpe Ratio of 0.60, which was our assumption in Table 5. The portfolio with the highest Sharpe Ratio, 0.95, turns out to be the 20/50/30 stock/bond/managed futures portfolio. Individually, this portfolio has an expected return of 6.1%, which is not highest. Nor is its volatility of 5.4% the lowest among all portfolios. It does have the highest reward-to-risk ratio, however, and is therefore in some sense the “optimal” or best portfolio in terms of the trade-off between risk and return.
Let us try to explain why this might be the case, by addressing the question we set out to answer at the outset: The relative risk contributions of the three component asset classes to the overall risk of the portfolio. We show these data in the three panels of Table 9.
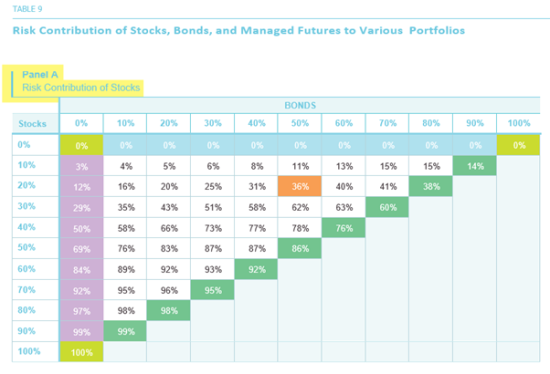
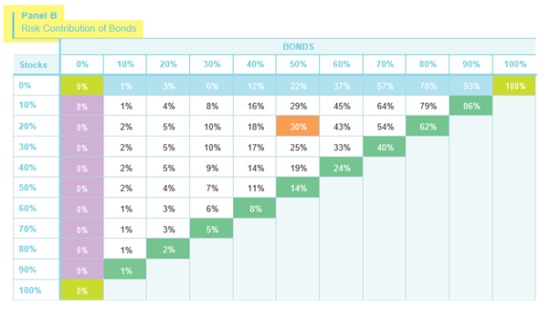
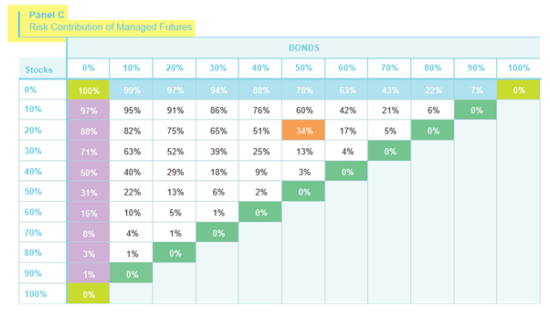
Consider the 20/50/30 portfolio from Table 8, which had the highest Sharpe Ratio. It turns out that the three asset classes contribute almost equally to the risk of this portfolio: stocks contribute 36%, bonds 30% and managed futures 34%. A portfolio in which the risk contributions of various components are equalized is sometimes called a “risk parity” portfolio.[10]
This turns out to be a very rough rule-of-thumb: it is not always necessary that the portfolio with the highest Sharpe Ratio is the “risk parity” portfolio, which is a term used to define the portfolio in which all the individual components contribute equally toward the total risk.
Using some very simple assumptions, we have shown that a “more diversified” portfolio, whose risk contributions are spread out across its component asset classes, turns out to have a higher reward-to-risk ratio than one with a significantly higher risk contribution from one asset class such as stocks. This reiterates one of the teachings of Modern Portfolio Theory (MPT): Diversification helps.
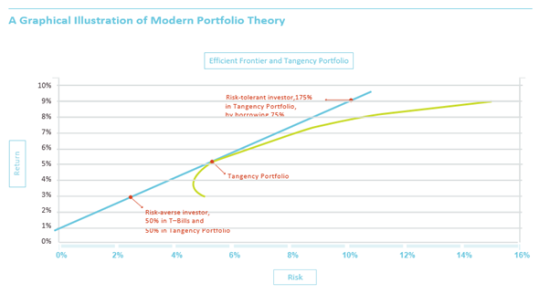
MPT goes on to state that the portfolio with the highest Sharpe Ratio, also called the “tangency portfolio,” is the optimal risky portfolio for all investors. Each investor has the ability to combine this portfolio (which turns out in equilibrium to be the “market portfolio”) with risk-free lending or borrowing, so that he/she ends up holding an overall portfolio still with the highest Sharpe Ratio, but with an appropriate level of risk. Relatively risk-averse investors combine the market portfolio with risk-free lending (i.e., investing in cash or T-Bills) to “dilute” their risk and earn a lower return. As shown above, a risk-averse investor can invest 50% of her total wealth in T-Bills earning 1% and 50% in the tangency portfolio, thereby reducing risk to about 2.7% with an expected return of about 3%.
A more risk-tolerant investor can, in theory, borrow say 75% at the risk-free rate and leverage the risky portfolio to 175%, taking on greater risk of about 9.5% while seeking to earn a higher return of close to 9%. One constraint that MPT imposes on the tangency portfolio is that the allocations sum up to 100%, even when borrowing or lending is involved. In the next part of this series of Insights, we will examine the effects of relaxing this constraint: for example, we will examine portfolios with 50% allocated to managed futures, but in a 60/40/50 portfolio rather than a traditional 30/20/50 portfolio. Note that the allocations in the traditional portfolio add up to 100%, while those in the other portfolio add up to 150%.
Extended diversification may enable investors to potentially harness the combined benefit of their current portfolio AND managed futures. The traditional “OR” decision involves selling part of the existing stock and/or bond holdings in order to gain exposure to a diversifying asset class such as managed futures: the portion that is allocated involves a choice between managed futures OR stocks/bonds. Thus, the allocation to managed futures may incur the opportunity cost of forgoing the returns that stocks and bonds might have continued to earn. Extended diversification seeks to allow investors to hold on to their stocks and bonds AND allocate to managed futures, without the opportunity cost of selling stocks and bonds.
In many cases, by managing allocations appropriately, this can potentially be achieved without taking on the significant increase in risk of a portfolio that is leveraged traditionally through borrowing.
**********
Dr Ajay Dravid is the Chief Investment Officer of Equinox Institutional Asset Management
This article is an abridged version of The Risk Contribution of Stocks
Footnotes
- [7] For the sake of consistency, we use the same values for stocks and bonds that we used in our previous Insight
- [8] We discuss Sharpe Ratio later in the paper. This assumption of equal Sharpe ratios has the effect of seeking to minimize the bias in favour of any asset class. The expected returns we assume are loosely based on their historical realized values. The substantive conclusions of this Insight do not depend on the assumptions, however.
- [9] The green-shaded numbers are identical to those shown in our previous Insight.
- [10] Since there can be different measures of risk, there is no unique definition of risk parity.
***
The views expressed in this article are those of the author and do not necessarily reflect the views of AlphaWeek or its publisher, The Sortino Group
© The Sortino Group Ltd
All Rights Reserved. No part of this publication may be reproduced, stored in a retrieval system or transmitted in any form or by any means, electronic, mechanical, photocopying, recording or scanning or otherwise, except under the terms of the Copyright, Designs and Patents Act 1988 or under the terms of a licence issued by the Copyright Licensing Agency or other Reprographic Rights Organisation, without the written permission of the publisher. For more information about reprints from AlphaWeek, click here.


