


Kettera Strategies Heat Map - August 2025
The following highlights four of the various style categories that Kettera covers.
Discretionary Global Macro
In August, discretionary global macro managers generally performed well, with many profiting from concentrated trades in metals, rates, and (certain) currencies. Long positions in precious metals—particularly gold and silver—were consistent profit centers across several managers that we track, who framed the trades as expressions of fiat debasement and continued central bank buying. Several funds benefited from long positions in short-duration U.S. Treasuries (2Y), as expectations of imminent rate cuts drove yields lower. However, other managers were hurt by long exposure to the long end of some European yield curves (particularly the German curve), which sold off sharply amid rising fiscal concerns. Short U.S. dollar exposure via long GBP positions (as well as some commodity focused currencies) also contributed positively for some funds. Energy and equity exposures appeared minimal or neutral, suggesting most managers emphasized macro thematics over directional risk in beta-sensitive assets.
Systematic Trend
Long term systematic trend performed well in August, generally posting gains in multiple sectors. Long equities clearly outperformed as indices rose in the US, Asia, and slightly in Europe. Long US rates (2-Yrs) was profitable for most programs, but certainly not all, as models jumped on the developing trend of the Fed cutting rates in late September. Long precious metals, particularly gold and silver, was the standout trade in the commodities sector, along with long feeder cattle. Short soybeans and long crude and products detracted from performance. FX was mixed. Programs that jumped on the short US rates trend also tended to be short USD, which was profitable, especially vs. Japanese Yen, Euro, and British Pound. Performance, good or bad, was less about the duration of the program (medium term and long term programs did well overall), and more about positioning and sizing (overweight/underweight).
Commodities Specialists – Agricultural Traders
Agricultural funds – almost all of whom are discretionary - generally faced a challenging month, driven largely by positioning misalignments across the grain and livestock markets. Many funds were short soybeans and caught offside as the market unexpectedly rallied on tighter-than-expected U.S. soybean acreage and nearby soymeal strength. Some programs were long corn early in the month, anticipating bullish follow-through from USDA crop reports, but the massive upward revision to corn yield and production figures forced rapid position reversals and losses. Cattle exposure—which has been a profitable theme in prior months—also contributed negatively, as elevated beef prices began to weigh on demand and prompted packer kill cuts, setting up a potential correction that caught some managers off guard. Overall, August punished high-conviction trades that leaned into structural supply stories – particularly those that lacked enough flexibility to adjust to shifting short-term sentiment.
Currency Specialists
After a good run over the last 12-18 months, both discretionary fundamental and systematic FX managers appeared to struggle in August, with most programs posting negative performance amid tight trading ranges, dislocated correlations, and a lack of sustained directional follow-through. The short-term systematic strategies we follow seemed particularly challenged, as fragmented G7 price action and compressed volatility triggered false momentum signals and neutralized mean-reversion exposures. Those systems relying on regime-switching or filtering saw limited success due to a breakdown of typical inter-pair relationships and low realized volatility outside of brief event spikes – e.g. U.S. payrolls report and the late August Jackson Hole symposium. Macro-driven discretionary programs, which are typically more long-term in nature, fared somewhat better, although performance was still mixed. Overall, August’s trading environment rewarded the patience of longer-term strategies.
August 2025 Style Map
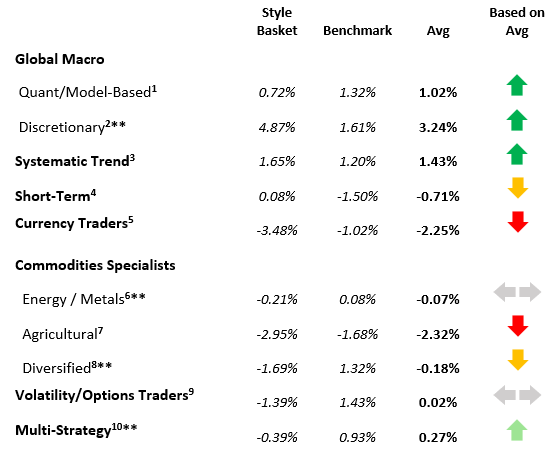
Past performance is not necessarily indicative of future results. See notes at end of this document for details on the construction of the hydra "baskets" and the benchmark used for each style class. Also note that some baskets may contain managers that have not yet reported by this date.
*=less than 75% reported.
**=less than 75% reported and absence of a core manager's return.
**********
Footnotes
The views and opinions expressed herein are those of the author and do not necessarily reflect the views of Kettera Strategies. The information set forth herein has been obtained or derived from sources believed by the author to be reliable. However, neither Kettera nor the author make any representation or warranty, express or implied, as to the information's accuracy or completeness, nor do Kettera or the author recommend that the attached information serve as the basis of any investment decision. This is provided to you solely for informational purposes only and does not constitute an offer or solicitation of an offer, or any advice or recommendation, to purchase any securities or other financial instruments, and may not be construed as such.
Kettera Strategies LLC is a Member of the National Futures Association and registered as a Commodity Pool Operator and only provides services to Accredited Investors who are Qualified Eligible Persons as defined in section 4.7 of the Commodity Exchange Act. This document, any attached document and cover email are being furnished to you on a confidential basis and may not, without prior written consent of Kettera Strategies LLC be (i) copied, photocopied or duplicated in any form, by any means, or (ii) distributed to any person that is not an employee, officer, director, or authorized agent of the intended recipient of this email. This document, and any related documents or emails, are neither offers to sell any securities, nor solicitations of an offer to invest in any fund or product.
For the “style classes” and “baskets” presented in this letter: The “style baskets” referenced above were created by Kettera for research purposes to track the category and are classifications drawn by Kettera Strategies in their review of programs on and for the Hydra Platform. The arrows represent the style basket’s overall performance for the month (e.g. the sideways arrow indicates that the basket was largely flat overall, a solid red down arrow indicates the basket (on average) was largely negative compared to most months, etc.). The “style basket” for a class is created from monthly returns (net of fees) of programs that are either: programs currently or formerly on Hydra; or under review with an expectation of being added to Hydra. The weighting of a program in a basket depends upon into which of these three groups the program falls. Style baskets are not investible products or index products being offered to investors. They are meant purely for analysis and comparison purposes. These also were not created to stimulate interest in any underlying or associated program. Nonetheless, as these research tools may be regarded to be “hypothetical” combinations of managers.
Further notes on Hydra Emerging Manager Basket: Weightings among managers were rebalanced every year, with exceptions for extraordinary events (e.g. the Covid market collapse). Weightings are not discretionary. Manager weightings were not increased over time except for going from a “pending” to a fully “approved” program; weighting reductions only occurred if the manager was de-listed or shut its doors – otherwise the managers stayed as is regardless of performance. Weightings are equal for any approval category: e.g. all fully approved managers may get a X% weighting, regardless of volatility/exposure levels or correlation with other strategies.
Hypothetical performance results have many inherent limitations, some of which are described below. No representation is being made that any product or account will achieve profits or losses similar to those shown. In fact, there are frequently sharp differences between hypothetical performance results and the actual results subsequently achieved by any particular trading program. One of the limitations of hypothetical results is that they are generally prepared with the benefit of hindsight. In addition, hypothetical trading does not involve financial risk, and no hypothetical trading record can completely account for the impact of financial risk in actual trading. There are numerous other factors related to the markets in general or to the implementation of any specific trading program which cannot be fully accounted for in the preparation of hypothetical performance results and all of which can adversely affect actual trading results.
Benchmark sources:
1- With Intelligence Systematic Macro Hedge Fund Index
2- With Intelligence Macro Hedge Fund Index
3- The Societe Generale Trend CTA Index
4- The Societe Generale Short-term Traders Index
5- The Barclay Currency Traders Index
6- Blend of Bridge Alternatives Commodity Hedge Fund Index and BarclayHedge Discretionary Traders Index
7- The Barclay Agricultural Traders Index
8- The Nilsson CTA Commodities Index
9- Blend of With Intelligence Volatility Arbitrage Index and With Intelligence Long Volatility Hedge Fund Index
10- Blend of With Intelligence Institutional Equity Hedge Multi Strategy Index and BarclayHedge Multi Strategy Index
Indices and other financial benchmarks shown are provided for illustrative purposes only, are unmanaged, reflect reinvestment of income and dividends and do not reflect the impact of advisory fees. Index data is reported as of date of publication and may be a month- to-date estimate if all underlying components have not yet reported. The index providers may update their reported performance from time to time. Kettera disclaims any obligation to verify these numbers or to update or revise the performance numbers.
Past performance is not necessarily indicative of future returns.
***
The views expressed in this article are those of the author(s) and do not necessarily reflect the views of AlphaWeek or its publisher, The Sortino Group
© The Sortino Group Ltd
All Rights Reserved. No part of this publication may be reproduced, stored in a retrieval system or transmitted in any form or by any means, electronic, mechanical, photocopying, recording or scanning or otherwise, except under the terms of the Copyright, Designs and Patents Act 1988 or under the terms of a licence issued by the Copyright Licensing Agency or other Reprographic Rights Organisation, without the written permission of the publisher. For more information about reprints from AlphaWeek, click here.


