


Human vs Machine and Equity Drawdown Protection: Does the Approach Make a Discernible Difference?
Will a machine take our job? The ‘human vs machine’ debate within investment management is a constant discussion. One side of the debate argues that machines are learning 24 hours a day and can take in, and analyse, more information than any person possibly can, while the other side argues that investment decisions need that subjective human touch, borne from experience, in order to truly succeed.
While this debate is unlikely to ever be settled to everyone’s satisfaction, we wanted to look at both investment processes, so we analyse the Equity Long Short (‘ELS’) strategy through its portfolio protection and inclusion benefits across areas including what is driving their returns, whether their returns can be cheaply replicated, do their portfolio protection characteristics stack up with expectations and finally, how does their alpha generation perform within different volatility conditions.
In this short research note, we look at the performance of ELS managers broken down by investment process to determine whether either a systematic or discretionary approach provides true equity portfolio protection – or whether neither does.
Equity Long Short Performance By Investment Process
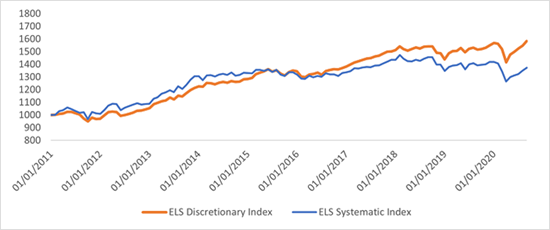
The first step in analysing whether ELS strategies provide portfolio protection is to compare the different investment process performances against each other and see what is driving returns from a factor perspective. In this section, we look at the performance of two ELS indices published by our partner NilssonHedge, a publicly available database of hedge fund returns: one Systematic, one Discretionary. Figure 1 below shows how each index performed over the analysis period from January 2011 to September 2020 (the dates are selected due to the availability of equity factor returns data). We notice a distinct changing of the guard as systematic managers outperformed until about halfway through the analysis period before discretionary managers take over and eventually show that they have provided better returns over the near 10-year time frame.
Figure 1: Equity LS Discretionary Index vs Equity LS Systematic Index
Source: Athlon Family Office
Due to the gross long exposure that most ELS hedge funds hold, we expect a significant amount of the returns delivered by these products to be driven by the market. Running a factor analysis on both ELS indices helps us to strip out known return drivers so we can see what the alpha generation of the investment process has been.
We do this by running a two-step regression; we run a regression against the S&P 500 to find the residuals return stream which represent the ELS returns minus the portion driven by the S&P 500 [ELS ex-Market]. We then take the ELS ex-Market return stream and run a multi-variable regression against a proprietary dataset of the most common equity factors to find the ELS ex-Market & Equity Factor performance.
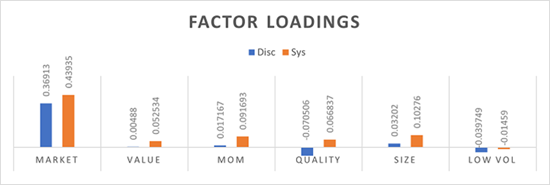
Figure 2 below shows us that the market is indeed the primary driver for returns, due to the gross long exposure they carry (as can be seen by the ‘MARKET’ factor coefficients). Interestingly, systematic managers have a stronger relationship with the market as shown by the .44 beta coefficient versus discretionary’s .37 beta coefficient. Given systematic managers’ more quantitative approach, it shouldn’t be surprising to see a stronger relationship with equity factors.
Figure 2: Market & Equity Factor Loadings
Source: Athlon Family Office
What Is Driving Equity Long Short Discretionary Returns?
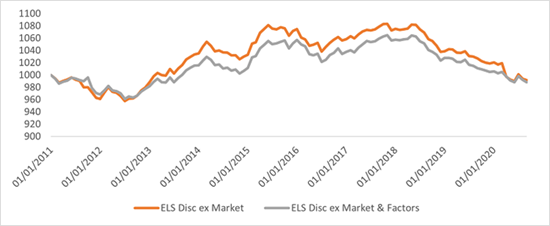
By running the two-step regression described above, we are able to see the ‘stripped’ performance of both ELS indices, i.e., the alpha generation of the indices. The alpha generation is shown by the ‘ELS Disc ex-Market & Factors’ line in Figure 3 below. The returns after stripping out just the market-driven returns are represented by the ‘ELS Disc ex-Market’ line. We can see that ELS Discretionary alpha stayed within a +/- 4% range while ending the analysis period flat. We can see that both market and equity factor accounts for all of the returns by the end of the analysis period – this is not what investors or allocators want to see as it means the strategies are bringing in no alpha.
Figure 3: Equity LS Discretionary ex Market & ex Equity Factors
Source: Athlon Family Office
What Is Driving Equity Long Short Systematic Returns?
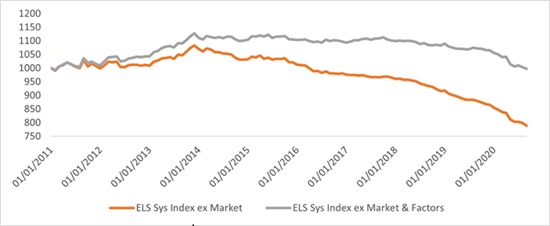
Using the same process as described above, we are able to analyse both the performance after stripping out just the market-driven returns and the alpha generation of the systematic ELS managers. Figure 4 below shows us that due to ELS Systematic managers having such a large beta coefficient, and adding to that, the strong performance of the market over the analysis period, when we strip out market-driven returns, the systematic managers actually lost nearly 25%. Their saviour was their performance driven from stronger equity-factor exposure versus their discretionary counterparts. This equity-factor driven return essentially covered those losses that came from the portion of their trading that was not driven by the market. Their alpha generation, however, was significantly above their discretionary counterparts, getting up to as much as approximately 10% in 2014; that 10% alpha generation did, however, disappear by the end of the analysis period where it came back to its breakeven level, thus providing no alpha over the whole analysis period.
Figure 4: Equity LS Systematic Index ex Market & Equity Factors
Source: Athlon Family Office
Equity Long Short Index Replication
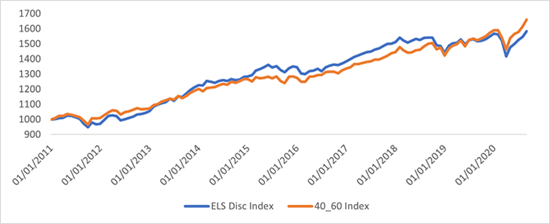
In this section we seek to replicate ELS discretionary and systematic returns via cheaper investment vehicles to determine whether paying the increased fees associated with hedge funds are justifiable from a return behaviour perspective. As Figure 5 below shows, when analysing ELS Discretionary Index returns versus a simple portfolio of 40% S&P 500 - 60% cash (a portfolio mix based off of their beta coefficient calculation in Figure 2 above), not only do we get a portfolio with a 91% correlation to the ELS Discretionary Index, but we also get a portfolio that outperforms its counterpart over the analysis period.
Figure 5: Equity LS Discretionary Index vs 40% S&P500 – 60% Cash Index
Source: Athlon Family Office
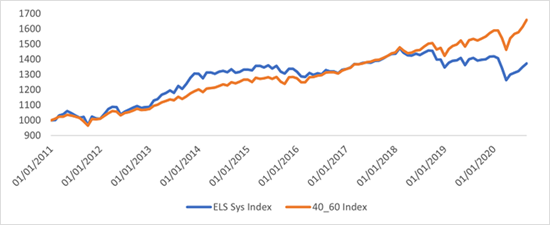
Figure 6 below shows that the ELS Systematic Index also exhibits a 91% correlation and underperformance to the 40-60 Equity-Cash portfolio. We do, however, see the ELS Systematic Index outperforming early in the time frame while towards the latter end of the period, there is significant underperformance.
Figure 6: Equity LS Systematic Index vs 40% S&P500 – 60% Cash Index
Source: Athlon Family Office
Diversification / Market Protection
Now that we have established that the return drivers of both indices are market and equity factor returns - and consequently we can replicate the performance of both indexes via cheaper alternatives - we move on to analysing both indices’ portfolio protection characteristics through their drawdown reduction and portfolio return expectancy to establish if it makes a difference whether the manager uses a discretionary or systematic approach. For portfolio protection, we look at the relationship between drawdown reduction and return reduction of the portfolio.
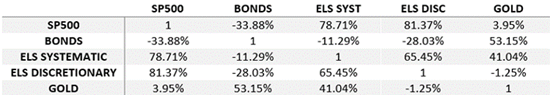
To analyse the portfolio protection and diversification characteristics, we want to see the return behaviour during the periods we need it the most – when the S&P 500 is down on the month. We created a portfolio only using the months where the S&P 500 lost money during the analysis period. We look at the correlation of the portfolio that includes both ELS indices and traditional safe havens – bonds and gold. As Table 1 below shows, the traditional hedges/safe havens showed a to-be- expected negative correlation (or what is essentially an uncorrelated figure) while both ELS indices show a strong positive correlation, averaging around +80%.
We used gold futures prices (‘GC=F’ ticker) and the 7-10-year US Bond ETF (‘IEF’ ticker) as the traditional safe-haven representatives.
Table 1: Correlation Matrix During Negative S&P500 Monthly Returns
Source: Athlon Family Office
We further test ELS’s portfolio protection benefit by creating blended portfolios comparing the inclusion of the ELS Indices versus the traditional portfolio protector of bonds to analyse both drawdown protection and return expectancy.
We created three portfolios using the traditional 60/40 mix for this analysis:
- 60% S&P 500 – 40% ELS Systematic Index,
- 60% S&P 500 – 40% ELS Discretionary Index, and
- 60% S&P 500 – 40% Bonds.
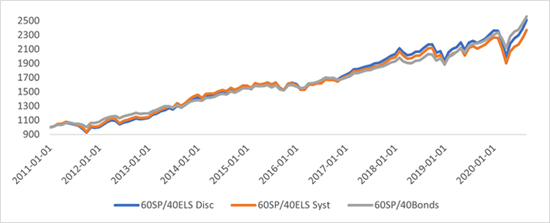
Figure 7 below shows virtually no dispersion through to 2016 before differences appear from that point onwards. The bond 60/40 portfolio provided the highest returns at the end of the analysis period.
Figure 7: 60/40 Portfolio Analysis
Source: Athlon Family Office
As Table 2 below shows, what may not be surprising is that the S&P 500 + Bond portfolio has lowest drawdowns over the lifetime versus its peers and a better risk-adjusted return, but what may be surprising to many is that the S&P 500 + Bond portfolio also outperformed its S&P 500 + ELS peer in an absolute return basis as well.
Table 2: 60/40 Portfolio Performance Metrics
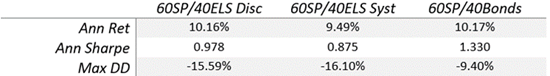
Source: Athlon Family Office
Relationship With Volatility
When analysing this research note’s results, two things jump out: firstly, alpha generation in both investment processes dropped to zero towards the end of the investment period and the end of the investment period is the highest volatility period. I then thought about a statement that many hedge fund managers of all strategies make: higher volatility is conducive to higher alpha generation. This section sets out to analyse whether volatility and alpha generation do indeed have a positive relationship.
To analyse performance within volatility regimes, we took the daily VIX level and calculated the month’s average VIX level. We then separated returns into two portfolios: High Volatility Environment & Low Volatility Environment. The portfolios were separated by a proprietary threshold level calculated internally.
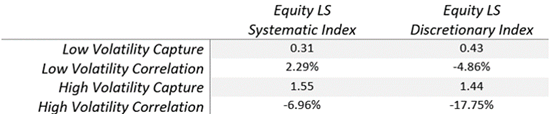
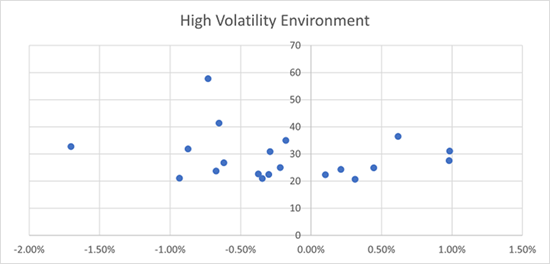
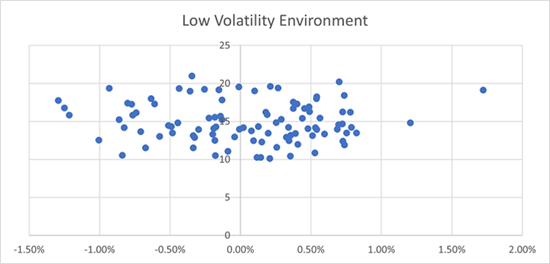
Table 3 below shows us the numerical relationship between the ELS Indices’ alpha generation and the two volatility regimes we have created, while Figures 8 and 9 below provides a visual representation of alpha generation during both volatility conditions for each ELS investment process. It’s clear that all situations are quite uncorrelated. Despite what some hedge fund managers claim, ELS alpha generation is negatively correlated to volatility within high volatility environments for both investment processes; and both indices exhibit a low correlation to volatility in low volatility conditions. To add salt to the wound, ELS provides only 31% (systematic) and 43% (discretionary) of the low volatility condition return capture (positive market performance) while providing, on average, 150% of the market losses during high volatility conditions. Discretionary managers provide both a better low volatility capture and high volatility capture than their systematic counterparts.
Table 3: Volatility Regime Performance Metrics
Source: Athlon Family Office
Figure 8: Scatterplot of ELS Discretionary Index Alpha during High & Low Volatility Environments
Source: Athlon Family Office
Figure 9: Scatterplot of ELS Systematic Index ‘Alpha’ during High & Low Volatility Environments
Source: Athlon Family Office
Conclusion and Further Thought
Critics of this research will point out that we have used an ELS Index, or average, of returns. Within this index’s universe, there will be outperformers and underperformers; indeed, the hedge fund industry is famous for the broad range of dispersion amongst fund returns. Indices also bring a natural level of survivorship bias, which tends to overexaggerate the long-term returns from the Index. This research, however, can be used to analyse individual funds instead of an average or index level return profile and can be further boosted by using daily data to analysis ELS performance during market volatility instead of monthly data which was used within this research note.
Both ELS investment processes of systematic and discretionary returns have been highly dependent on market returns. That in itself is not a bad thing once the non-market dependent return portion provides what investors expect. Our analysis not only shows that the belief that ELS funds provides equity portfolio protection is incorrect, but it also shows that the pricey fees investors pay for ELS returns can be easily and cheaply recreated via ETF & Cash holdings. To add salt to the wound, a simple traditional Equity & Bond portfolio not only provides superior protection on equity drawdowns but also outperforms the Equity & ELS portfolio in an absolute return basis for both investment processes.
Despite the Equity/Bond portfolio producing better returns and portfolio protection, that may not be a feasible solution in the current macroeconomic environment due to interest rates at current zero-lower-bound levels. Taking this option in the current market environment, given current interest rates, should be cautioned.
**********
Karl Rogers is Co-Founder & Managing Partner of Athlon Family Office
***
The views expressed in this article are those of the author and do not necessarily reflect the views of AlphaWeek or its publisher, The Sortino Group
© The Sortino Group Ltd
All Rights Reserved. No part of this publication may be reproduced, stored in a retrieval system or transmitted in any form or by any means, electronic, mechanical, photocopying, recording or scanning or otherwise, except under the terms of the Copyright, Designs and Patents Act 1988 or under the terms of a licence issued by the Copyright Licensing Agency or other Reprographic Rights Organisation, without the written permission of the publisher. For more information about reprints from AlphaWeek, click here.


