


Kettera Strategies Heat Map - April 2023
Discretionary Macro Strategies
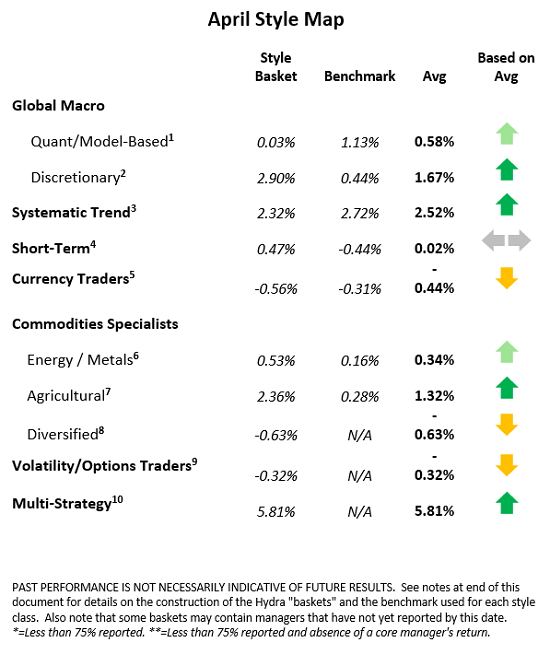
Discretionary Global Macro managers experienced a wide range of results in April, although the better performing programs took concentrated positions in commodities, currencies, and equities. Notable directional positions that yielded profits included short agricultural markets, long precious metals, long European equities, and long European currencies (euro, British pound, Swiss franc) versus the USD. The less successful programs appeared to be those tangled up in choppy fixed income markets (e.g. longer term bonds and short dated rates) while also missing the aforementioned profitable positions.
Systematic Trend Strategies
While March brought one of the worst months in the history of systematic futures trading, April saw systematic trend programs generate mostly positive returns. The array of returns for the programs we follow was a widely dispersed one, ranging from just slightly negative to around +10% on the month - depending on portfolio mix and length of average models. It seems the medium-term programs had the most success, with the shorter-term programs performing poorly and the longer-term strategies decently. The most profitable of the medium- to longer-term programs seemed to be those with long sugar and long coffee positions, two relatively obscure markets that made an outsized impact in April. From a sector standpoint, commodities, (particularly short ag exposures) and FX (particularly long European major currencies vs. USD) were generally the best performing asset classes.
Commodities Specialists – Agricultural
Programs specializing in agricultural and livestock trading were generally profitable in April – largely from directional short and short-biased spread trading in corn and the soybean complex (beans, soymeal, soy oil), and long exposure in cattle markets. After a choppy first half of the month, corn and soybeans broke on fundamentals including ample supplies out of Brazil, low demand for US exports, amicable weather conditions in the US, and heightened competition. Several programs also caught the upward moves in sugar and coffee, trading those directionally.
Commodities Specialists – Metals/Energies
Of the metals specialists that we track, the more profitable programs translated global macro events (inflation, bank crisis, etc) into long gold and precious metals, while shorting industrial metals (e.g. copper, iron ore) on the back of poor demand. Energy trading specialists faced a month of choppy price behavior, with OPEC’s attempts to manipulate the market facing off vs. weak demand. Natural gas programs we follow – mostly spread programs – ended the month just slightly positive.
**********
Footnotes:
For the “style classes” and “baskets” presented in this letter: The “style baskets” referenced above were created by Kettera for research purposes to track the category and are classifications drawn by Kettera Strategies in their review of programs on and for the Hydra Platform. The arrows represent the style basket’s overall performance for the month (e.g. the sideways arrow indicates that the basket was largely flat overall, a solid red down arrow indicates the basket (on average) was largely negative compared to most months, etc.). The “style basket” for a class is created from monthly returns (net of fees) of programs that are either: programs currently or formerly on Hydra; or under review with an expectation of being added to Hydra. The weighting of a program in a basket depends upon into which of these three groups the program falls. Style baskets are not investible products or index products being offered to investors. They are meant purely for analysis and comparison purposes. These also were not created to stimulate interest in any underlying or associated program. Nonetheless, as these research tools may be regarded to be “hypothetical” combinations of managers, hypothetical performance results have many inherent limitations, some of which are described below. no representation is being made that any product or account will achieve profits or losses similar to those shown. in fact, there are frequently sharp differences between hypothetical performance results and the actual results subsequently achieved by any particular trading program. one of the limitations of hypothetical results is that they are generally prepared with the benefit of hindsight. in addition, hypothetical trading does not involve financial risk, and no hypothetical trading record can completely account for the impact of financial risk in actual trading. there are numerous other factors related to the markets in general or to the implementation of any specific trading program which cannot be fully accounted for in the preparation of hypothetical performance results and all of which can adversely affect actual trading results..
Benchmark sources:
- Blend of Eurekahedge Macro Hedge Fund Index and IndexIQ Hedge Global Macro Beta Index
- The IndexIQ Hedge Global Macro Beta Index: (same link as above)
- The Societe Generale Trend CTA Index
- The Societe Generale Short-term Traders Index: (same link as above)
- The Barclay Hedge Currency Traders Index
- Blend of Bridge Alternatives Commodity Hedge Fund Index and Barclay Discretionary Traders Index
- The Barclay Agricultural Traders Index: (same link as above)
- The Eurekahedge Commodity Hedge Fund Index
- Blend of CBOE Eurekahedge Relative Value Volatility Hedge Fund Index and CBOE Eurekahedge Long Volatility Index
- Blend of Eurekahedge Asset Weighted Multi Strategy Asset Weighted Index and Barclay Hedge Fund Multi Strategy Index
- Eurekahedge Long Short Equities Hedge Fund Index
- Eurekahedge Event-Driven Hedge Fund Index
Indices and other financial benchmarks shown are provided for illustrative purposes only, are unmanaged, reflect reinvestment of income and dividends and do not reflect the impact of advisory fees. index data is reported as of date of publication and may be a month-to-date estimate if all underlying components have not yet reported. the index providers may update their reported performance from time to time. Kettera disclaims any obligation to verify these numbers or to update or revise the performance numbers.
***
The views expressed in this article are those of the author and do not necessarily reflect the views of AlphaWeek or its publisher, The Sortino Group
© The Sortino Group Ltd
All Rights Reserved. No part of this publication may be reproduced, stored in a retrieval system or transmitted in any form or by any means, electronic, mechanical, photocopying, recording or scanning or otherwise, except under the terms of the Copyright, Designs and Patents Act 1988 or under the terms of a licence issued by the Copyright Licensing Agency or other Reprographic Rights Organisation, without the written permission of the publisher. For more information about reprints from AlphaWeek, click here.