


Kettera Strategies Heat Map - August 2020
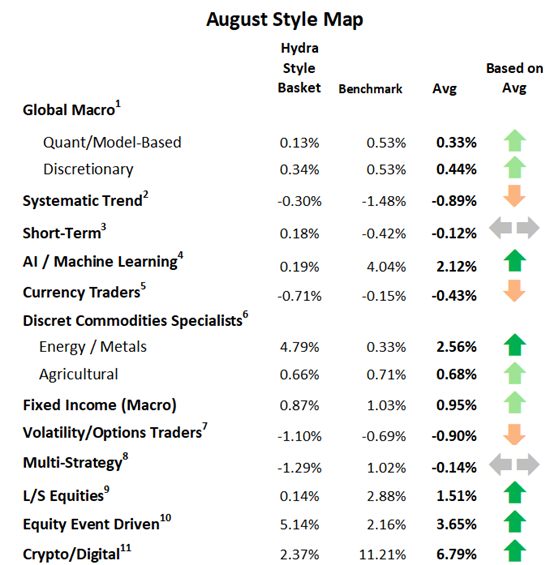
While July was one of the best months we’ve ever recorded for discretionary macro strategies, August was a bit more muted – but generally positive. The most profitable sectors and themes appeared to be yield curve strategies, long emerging market credit, and long commodities. Directional positions in indices and FX seemed to pose more challenges.
In Quant Macro, among the programs we track, the common theme on the profitable side seemed to be short fixed income. And, in contrast to their discretionary cousins, equities markets proved more profitable – although commodities trades didn’t appear to be a big producer.
Systematic Trend Programs showed a mixed bag for August – with a few outliers plus and minus - but in the aggregate most programs were slightly negative on average. Regardless of return, nearly all fit the same pattern: Profitable long positions in equities, long metals, and short USD; with losses coming mostly in long fixed income, short natural gas and power markets, and short agricultural commodities.
Metals & Energy Specialists saw profits nearly across the board for both directional and spread traders in this group. Positions in natural gas seemed to be the biggest contributor for many.
Short-term & Higher Frequency Traders suffered in August. For most programs, losses came largely from fixed income and equity indices, while FX seemed to be generally positive. These programs vary in market exposures and trade length, and the more frequent traders (intraday to 3 days) – particularly break-out based programs - seemed to face more challenges than others.
August was yet another positive month for the Long/Short Equities programs we follow, and for the industry generally. July and August belonged to the “risk on” programs with greater exposure to big tech. We saw several outliers to the upside in Event Driven strategies, with some monthly returns touching 10%+.
**********
Footnotes:
For the “style classes” and “baskets” presented in this letter: The “style baskets” referenced above were created by Kettera for research purposes to track the category and are classifications drawn by Kettera Strategies in their review of programs on and for the Hydra Platform. The arrows represent the style basket’s overall performance for the month (e.g. the sideways arrow indicates that the basket was largely flat overall, a solid red down arrow indicates the basket (on average) was largely negative compared to most months, etc.). The “style basket” for a class is created from monthly returns (net of fees) of programs that are either: programs currently or formerly on Hydra; or under review with an expectation of being added to Hydra. The weighting of a program in a basket depends upon into which of these three groups the program falls. Style baskets are not investible products or index products being offered to investors. They are meant purely for analysis and comparison purposes. These also were not created to stimulate interest in any underlying or associated program. Nonetheless, as these research tools may be regarded to be “hypothetical” combinations of managers, hypothetical performance results have many achieved by any particular trading program. One of the limitations of hypothetical results is that they are generally prepared with the benefit of hindsight. In addition, hypothetical trading does not involve financial risk, and no hypothetical trading record can completely account for the impact of financial risk in actual trading. There are numerous other factors related to the markets in general or to the implementation of any specific trading program which cannot be fully accounted for in the preparation of hypothetical performance results and all of which can adversely affect actual trading results.
Benchmark sources:
1-The Hedge Fund Intelligence Global Macro Index and HFI Currency Index
2-The Societe Generale Trend Index and SG CTA Index
3-The Societe General Short-term Traders Index: (same link as above)
4-The Eurekahedge AI Hedge Fund Index
5-The BarclayHedge Currency Traders Index and BTOP FX Traders Index
6- S&P GSCI Metals & Energy Index and S&P GSCI Ag Commodities Index
7-The CBOE Eurekahedge Relative Value Volatility Hedge Fund Index
8-The Eurekahedge-Mizuho Multi-Strategy Index: (See above)
9-The Eurekahedge Long Short Equities Hedge Fund Index: (See above)
10-Blend of BarclayHedge Equity Market Neutral Index with Eurekahedge Equity Mkt Neutral Index (see link above)
11 – Bloomberg Galaxy Crypto Index.
Indices and other financial benchmarks shown are provided for illustrative purposes only, are unmanaged, reflect reinvestment of income and dividends and do not reflect the impact of advisory fees. Index data is reported as of date of publication and may be a month-to-date estimate if all underlying components have not yet reported. The index providers may update their reported performance from time to time. Kettera disclaims any obligation to verify these numbers or to update or revise the performance numbers.
***
The views expressed in this article are those of the author and do not necessarily reflect the views of AlphaWeek or its publisher, The Sortino Group
© The Sortino Group Ltd
All Rights Reserved. No part of this publication may be reproduced, stored in a retrieval system or transmitted in any form or by any means, electronic, mechanical, photocopying, recording or scanning or otherwise, except under the terms of the Copyright, Designs and Patents Act 1988 or under the terms of a licence issued by the Copyright Licensing Agency or other Reprographic Rights Organisation, without the written permission of the publisher. For more information about reprints from AlphaWeek, click here.