


Kettera Strategies Heat Map - August 2021
While the overall average for longer-term systematic trend programs in August was flat, this hides the fact that returns were actually scattered across the board. Interestingly, despite the divergent returns, the patterns of how and where P/L was generated was not dissimilar among the various managers: Long equities was the largest contributor, long European fixed income and most commodities markets were the detractors. One interesting note was that the systematic trend programs that truly performed held exposures in soft commodities (e.g. coffee and sugar), a sector that relatively few trend programs tend to emphasize.
August was a very frustrating month for directional trading in the metals markets and crude and refined products, with the possible exception of natural gas long and bull spreads trades in the second half of the month. Most markets in this sector experienced sharp mid-month reversals (initially sharply down, then a bounce to the upside). But most of the relative value / arbitrage / spread programs that we follow performed admirably, with some interesting spread premium trades in iron ore and copper.
While last month's profits for agricultural commodities specialists seemed to come more from relative value / spread programs / asymmetric options positioning, this month the “shorts” prevailed in corn and soybeans, while long wheat was a common profitable trade and most likely the easiest to capture fundamentally. While the returns of most programs in this sector were muted, some outperformed thanks to long positioning in softs markets (e.g. sugar).
Short-Term strategies struggled with the choppiness in many of the markets mentioned above, and it appears the intraday traders were hit the hardest (which is not typically the case in this category). Although these strategies are typically uncorrelated to each other, with little consistency among players in this category, a few generalized observations can be made for August: In equities short-term long positions outperformed counter-trend trades, while nearly all types of strategies underperformed in fixed income and FX.
Not unlike their systematic trend cousins above, the best market sector for quantitative global macro was equities, although short volatility positions were also net positive for those managers trading these markets. Fixed income was a mixed bag for most quant macro managers, as models based on behaviour and sentiment failed to predict the downward retracement in global markets, especially European bonds, while many econometric-based models warned of a correction. FX was another difficult sector as USD weakened against G10 and commodity currencies by mid-month, only to give back most of the gains into the end of the month (especially against NZD). The abrupt reversal tripped up many quant macro managers, who tend to look longer-term. Although commodities is not a sector of focus for all macro managers, those with exposures in the energy complex - or in certain intermarket spread strategies (e.g. energy vs industrial metals) – generated some outlier returns.
**********
Footnotes:
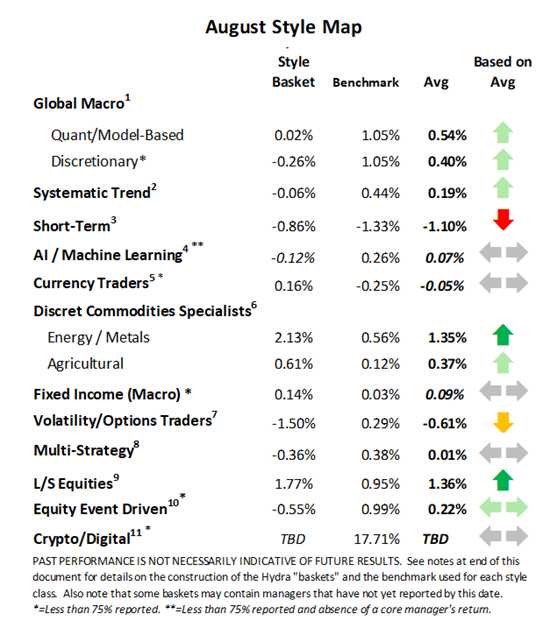
For the “style classes” and “baskets” presented in this letter: The “style baskets” referenced above were created by Kettera for research purposes to track the category and are classifications drawn by Kettera Strategies in their review of programs on and for the Hydra Platform. The arrows represent the style basket’s overall performance for the month (e.g. the sideways arrow indicates that the basket was largely flat overall, a solid red down arrow indicates the basket (on average) was largely negative compared to most months, etc.). The “style basket” for a class is created from monthly returns (net of fees) of programs that are either: programs currently or formerly on Hydra; or under review with an expectation of being added to Hydra. The weighting of a program in a basket depends upon into which of these three groups the program falls. Style baskets are not investible products or index products being offered to investors. They are meant purely for analysis and comparison purposes. These also were not created to stimulate interest in any underlying or associated program. Nonetheless, as these research tools may be regarded to be “hypothetical” combinations of managers, hypothetical performance results have many inherent limitations, some of which are described below. No representation is being made that any product or account will achieve profits or losses similar to those shown. In fact, there are frequently sharp differences between hypothetical performance results and the actual results subsequently achieved by any particular trading program. One of the limitations of hypothetical results is that they are generally prepared with the benefit of hindsight. In addition, hypothetical trading does not involve financial risk, and no hypothetical trading record can completely account for the impact of financial risk in actual trading. There are numerous other factors related to the markets in general or to the implementation of any specific trading program which cannot be fully accounted for in the preparation of hypothetical performance results and all of which can adversely affect actual trading results.
Benchmark sources:
1-The IndexIQ Hedge Global Macro Beta Index
2-The Societe Generale Trend Index and SG CTA Index
3-The Societe General Short-term Traders Index: (same link as above)
4-The Eurekahedge AI Hedge Fund Index
5-The BarclayHedge Currency Traders Index and BTOP FX Traders Index
6- The BarclayHedge Discretionary Traders Index and Barclay Ag Traders Index and NilssonHedge Commodities CTA Index
7-The CBOE Eurekahedge Relative Value Volatility Hedge Fund Index
8-The Eurekahedge-Mizuho Multi-Strategy Index: (See above)
9-The Eurekahedge Long Short Equities Hedge Fund Index: (See above)
10-Blend of BarclayHedge Equity Market Neutral Index with Eurekahedge Equity Mkt Neutral Index (see link above)
11 – Barclay Crypto Traders Index.
Indices and other financial benchmarks shown are provided for illustrative purposes only, are unmanaged, reflect reinvestment of income and dividends and do not reflect the impact of advisory fees. Index data is reported as of date of publication and may be a month-to-date estimate if all underlying components have not yet reported. The index providers may update their reported performance from time to time. Kettera disclaims any obligation to verify these numbers or to update or revise the performance numbers.
***
The views expressed in this article are those of the author and do not necessarily reflect the views of AlphaWeek or its publisher, The Sortino Group
© The Sortino Group Ltd
All Rights Reserved. No part of this publication may be reproduced, stored in a retrieval system or transmitted in any form or by any means, electronic, mechanical, photocopying, recording or scanning or otherwise, except under the terms of the Copyright, Designs and Patents Act 1988 or under the terms of a licence issued by the Copyright Licensing Agency or other Reprographic Rights Organisation, without the written permission of the publisher. For more information about reprints from AlphaWeek, click here.