


Kettera Strategies Heat Map - June 2022
Systematic Trend Managers
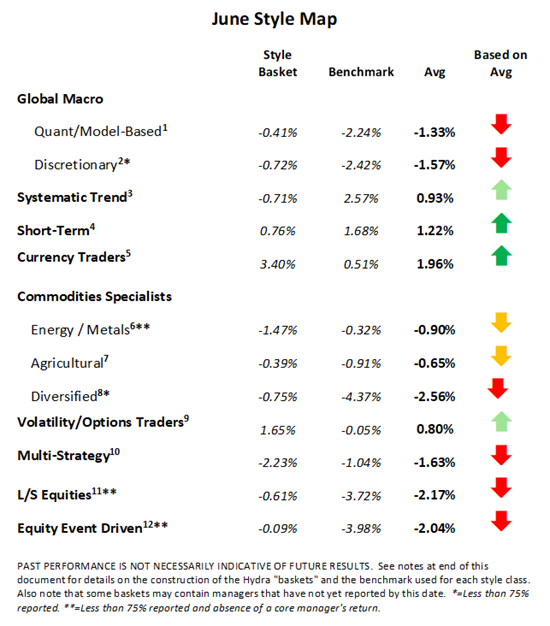
Long term trend following programs were generally positioned in a similar fashion across all markets, with the biggest differentiator being how the portfolio over- and under-weighted key sectors. The more profitable programs appeared to emphasize short fixed income and short equities indices positions, although nearly all programs seemed to sustain losses in long energy (crude oil / natural gas) positions and long ag commodities. In fact, June was a rare case in which the trend followers in Kettera’s style basket underperformed the industry benchmark, as many of our managers appeared to be over-allocated to long positions in energy and ag commodities.
Discretionary Global Macro Managers
Most of the discretionary global macro managers we follow were quite diversified in exposures and concentrations across all markets. This is an indication of how tricky the current global macroeconomic environment has been to navigate, as the world deals with higher inflation numbers, recession fears, monetary tightening, and geopolitical upheaval. Successful programs were short fixed income and rates, particularly in Europe, and were long USD vs. G10 and commodity currencies such as the Aussie dollar, Canadian dollar, Brazilian real and South African rand. The discretionary macro programs we follow appeared to be hardest hit in the commodities sector, especially from long exposures in the energy markets, grains, and base metals, as macro fears overwhelmed underlying micro fundamentals.
Commodity Specialists - Agricultural (Grains / Livestock)
Most grain trading programs, whether using spreads or outright directional trades, appeared to start the month with either a long bias in the grain markets or with very light positioning – and not much in between. Long-biased portfolios lost on the month as grains reversed mid-month due to “less damaging than expected” weather forecasts in the US, increasing recession fears, renewed lockdowns in China, and a benign USDA acreage report released at month-end that saw grains markets sell off sharply. Few programs, it seemed, were willing to take the risk of going short and capitalize on the broad-based selloff.
Commodities Specialists - Industrial (Energy / Metals)
Kettera’s style basket for this strategy category was slightly negative in June, as performance from metals programs overwhelmed positive performance from energy programs. Base metals sold off harshly on macroeconomic fears of recession and lower demand expectations, which overwhelmed fundamental traders that were positioned long (or long-biased) based on bullish underlying supply shortages. Precious metals, especially gold, are often held as an inflation hedge, but with a strong USD and rising yields, gold and silver sold off as well. Energy traders, especially spread traders in natural gas, were generally able to profit from falling prices, although some were rewarded with long exposure to European power.
Shorter-Term Strategies
Always a difficult category to generalize on, short-term trading covers a wide variety of programs, of varying holding period lengths. In June, however, there were a few common themes. Intraday breakout-based systems seemed to fare well, particularly in FX and equities indices (the latter particularly on the short side). The most difficult sector for most programs was fixed income, particularly in the middle part of the month when the bond trend changed directions.
**********
Footnotes:
For the “style classes” and “baskets” presented in this letter: The “style baskets” referenced above were created by Kettera for research purposes to track the category and are classifications drawn by Kettera Strategies in their review of programs on and for the Hydra Platform. The arrows represent the style basket’s overall performance for the month (e.g. the sideways arrow indicates that the basket was largely flat overall, a solid red down arrow indicates the basket (on average) was largely negative compared to most months, etc.). The “style basket” for a class is created from monthly returns (net of fees) of programs that are either: programs currently or formerly on Hydra; or under review with an expectation of being added to Hydra. The weighting of a program in a basket depends upon into which of these three groups the program falls. Style baskets are not investible products or index products being offered to investors. They are meant purely for analysis and comparison purposes. These also were not created to stimulate interest in any underlying or associated program. Nonetheless, as these research tools may be regarded to be “hypothetical” combinations of managers, hypothetical performance results have many inherent limitations, some of which are described below. no representation is being made that any product or account will achieve profits or losses similar to those shown. in fact, there are frequently sharp differences between hypothetical performance results and the actual results subsequently achieved by any particular trading program. one of the limitations of hypothetical results is that they are generally prepared with the benefit of hindsight. in addition, hypothetical trading does not involve financial risk, and no hypothetical trading record can completely account for the impact of financial risk in actual trading. there are numerous other factors related to the markets in general or to the implementation of any specific trading program which cannot be fully accounted for in the preparation of hypothetical performance results and all of which can adversely affect actual trading results.
Benchmark sources:
- Blend of Eurekahedge Macro Hedge Fund Index and BarclayHedge Global Macro Index
- The Eurekahedge Macro Index
- The Société Générale Trend CTA Index
- The Société Générale Short-term Traders Index
- The Barclay Hedge Currency Traders Index
- Blend of Bridge Alternatives Commodity Hedge Fund Index and Barclay Discretionary Traders Index (for February only the Barclay index was used as the Bridge index was unavailable.)
- The Barclay Agricultural Traders Index: (same link as above)
- The Eurekahedge Commodity Hedge Fund Index
- Blend of CBOE Eurekahedge Relative Value Volatility Hedge Fund Index and CBOE Eurekahedge Long Volatility Index (same link)
- Blend of Eurekahedge Multi Strategy Asset Weighted Index and Barclay Hedge Fund Multi Strategy Index
Indices and other financial benchmarks shown are provided for illustrative purposes only, are unmanaged, reflect reinvestment of income and dividends and do not reflect the impact of advisory fees. index data is reported as of date of publication and may be a month-to-date estimate if all underlying components have not yet reported. the index providers may update their reported performance from time to time. Kettera disclaims any obligation to verify these numbers or to update or revise the performance numbers.
***
The views expressed in this article are those of the author and do not necessarily reflect the views of AlphaWeek or its publisher, The Sortino Group
© The Sortino Group Ltd
All Rights Reserved. No part of this publication may be reproduced, stored in a retrieval system or transmitted in any form or by any means, electronic, mechanical, photocopying, recording or scanning or otherwise, except under the terms of the Copyright, Designs and Patents Act 1988 or under the terms of a licence issued by the Copyright Licensing Agency or other Reprographic Rights Organisation, without the written permission of the publisher. For more information about reprints from AlphaWeek, click here.


