


Kettera Strategies Heat Map - June 2025
For the month of June, the following summaries highlight four of the ten style categories that we track.
Systematic Trend Programs
Long term trend following programs were generally higher in June although some programs still put up negative numbers, prolonging their performance drought. Positive programs were short US dollar vs. G10 (particularly GBP and Euro) and commodity currencies (MXN, BZL, CAD). Equities trading was positive with long positioning in the US driving returns, offset by small losses in long Euro equity indices. In Fixed Income, longs in Euro bonds hurt performance as yields rose despite an EU rate cut, but longs in US rates and bonds did well as yields dropped. In commodities, longs in the energy sector performed very well in the first half of the month, but were punished severely when a ceasefire between Israel and Iran was declared and the entire sector dropped precipitously. The under/over -weighting to energies probably determined whether a program was negative on the month. Elsewhere, longs in base and precious metals (copper, silver, platinum) did well. Medium-term trend programs outperformed the longer dated trend programs.
Discretionary Global Macro
Discretionary macro managers generally posted positive results in June, continuing to outperform their quant- and systematic-driven peers year-to-date amid a complex and sporadically volatile geopolitical and market backdrop. This came despite broad consensus among larger players that the U.S. economy may be starting to “fray,” with a generally bearish tilt toward U.S. equities—which, paradoxically, rose during the month. One traditional “global macro 1.0” veteran on our Hydra platform gained over 5%, benefiting from a seemingly contradictory but ultimately coherent portfolio: slightly short to neutral U.S. equities and long front-end rates—aligned with a recessionary outlook—while also holding long positions in heavy CapEx commodities (e.g. energies and metals) expressing confidence in persistent ex-U.S. growth and tight supply dynamics. Other managers, ending closer to flat, struggled with regional equity rotations—some shifting longs to Europe and shorting the U.S., which underperformed. FX consensus—short USD, long Euro and GBP—contributed positively, while rates and intra-Europe bond spreads detracted. Year-to-date, discretionary managers have benefited from their adaptability to tariffs and geopolitical volatility, exploiting inefficiencies that have challenged quant and trend-following systems.
Quant (Model-Driven) Macro
Quant Macro programs did well in June, led by the more fundamentally-based programs that rely on econometric data more heavily than price-based technical signals. The biggest profits were generated in the energy sector as longs in crude and products rallied earlier in the month. Programs were able to book gains and close out exposures before the sector sold off dramatically on news of the ceasefire between Israel and Iran. Short US dollar vs. G10 currencies was profitable, notably the GBP and Euro both of which hit multi-year highs vs. USD. Longs in copper and precious (silver, platinum) were profitable, as were shorts in soybeans and corn. Fixed income was mixed to negative as gains/losses across European, UK, and US instruments generally offset each other.
FX Specialists
June was a challenging month for most FX-only managers. Those short-term, price-driven systematic programs that were positive (although not all were) navigated the USD slide by rapidly rotating out of the dollar into commodity (MXN, CAD, BZL, Chile) and major currencies (GBP and Euro both reached multi-year highs vs. USD). Of those that also trade precious metals, an interesting footnote: One program fared well in its silver positions, while another that trades gold underperformed. The more longer-term, fundamentally-driven programs generated mixed results once again. One of the larger players sustained a relatively significant loss, as their ‘quantamental’ models reduced USD exposure more gradually which eroded returns as G10 currencies rallied against it. In short, June seemed to favor more nimble, shorter-term managers, while the (typically larger) fundamental managers were met with more challenges.
June 2025 Style Map
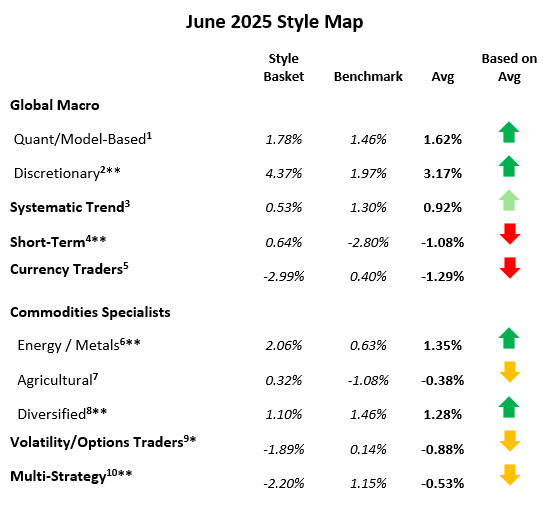
Past performance is not necessarily indicative of future results. See notes at end of this document for details on the construction of the hydra "baskets" and the benchmark used for each style class. Also note that some baskets may contain managers that have not yet reported by this date.
*=less than 75% reported.
**=less than 75% reported and absence of a core manager's return.
**********
Footnotes
The views and opinions expressed herein are those of the author and do not necessarily reflect the views of Kettera Strategies. The information set forth herein has been obtained or derived from sources believed by the author to be reliable. However, neither Kettera nor the author make any representation or warranty, express or implied, as to the information's accuracy or completeness, nor do Kettera or the author recommend that the attached information serve as the basis of any investment decision. This is provided to you solely for informational purposes only and does not constitute an offer or solicitation of an offer, or any advice or recommendation, to purchase any securities or other financial instruments, and may not be construed as such.
Kettera Strategies LLC is a Member of the National Futures Association and registered as a Commodity Pool Operator and only provides services to Accredited Investors who are Qualified Eligible Persons as defined in section 4.7 of the Commodity Exchange Act. This document, any attached document and cover email are being furnished to you on a confidential basis and may not, without prior written consent of Kettera Strategies LLC be (i) copied, photocopied or duplicated in any form, by any means, or (ii) distributed to any person that is not an employee, officer, director, or authorized agent of the intended recipient of this email. This document, and any related documents or emails, are neither offers to sell any securities, nor solicitations of an offer to invest in any fund or product.
For the “style classes” and “baskets” presented in this letter: The “style baskets” referenced above were created by Kettera for research purposes to track the category and are classifications drawn by Kettera Strategies in their review of programs on and for the Hydra Platform. The arrows represent the style basket’s overall performance for the month (e.g. the sideways arrow indicates that the basket was largely flat overall, a solid red down arrow indicates the basket (on average) was largely negative compared to most months, etc.). The “style basket” for a class is created from monthly returns (net of fees) of programs that are either: programs currently or formerly on Hydra; or under review with an expectation of being added to Hydra. The weighting of a program in a basket depends upon into which of these three groups the program falls. Style baskets are not investible products or index products being offered to investors. They are meant purely for analysis and comparison purposes. These also were not created to stimulate interest in any underlying or associated program. Nonetheless, as these research tools may be regarded to be “hypothetical” combinations of managers.
Further notes on Hydra Emerging Manager Basket: Weightings among managers were rebalanced every year, with exceptions for extraordinary events (e.g. the Covid market collapse). Weightings are not discretionary. Manager weightings were not increased over time except for going from a “pending” to a fully “approved” program; weighting reductions only occurred if the manager was de-listed or shut its doors – otherwise the managers stayed as is regardless of performance. Weightings are equal for any approval category: e.g. all fully approved managers may get a X% weighting, regardless of volatility/exposure levels or correlation with other strategies.
Hypothetical performance results have many inherent limitations, some of which are described below. No representation is being made that any product or account will achieve profits or losses similar to those shown. In fact, there are frequently sharp differences between hypothetical performance results and the actual results subsequently achieved by any particular trading program. One of the limitations of hypothetical results is that they are generally prepared with the benefit of hindsight. In addition, hypothetical trading does not involve financial risk, and no hypothetical trading record can completely account for the impact of financial risk in actual trading. There are numerous other factors related to the markets in general or to the implementation of any specific trading program which cannot be fully accounted for in the preparation of hypothetical performance results and all of which can adversely affect actual trading results.
Benchmark sources:
1- With Intelligence Systematic Macro Hedge Fund Index
2- With Intelligence Macro Hedge Fund Index
3- The Societe Generale Trend CTA Index
4- The Societe Generale Short-term Traders Index
5- The Barclay Currency Traders Index
6- Blend of Bridge Alternatives Commodity Hedge Fund Index and BarclayHedge Discretionary Traders Index
7- The Barclay Agricultural Traders Index
8- The Nilsson CTA Commodities Index
9- Blend of With Intelligence Volatility Arbitrage Index and With Intelligence Long Volatility Hedge Fund Index
10- Blend of With Intelligence Institutional Equity Hedge Multi Strategy Index and BarclayHedge Multi Strategy Index
Indices and other financial benchmarks shown are provided for illustrative purposes only, are unmanaged, reflect reinvestment of income and dividends and do not reflect the impact of advisory fees. Index data is reported as of date of publication and may be a month- to-date estimate if all underlying components have not yet reported. The index providers may update their reported performance from time to time. Kettera disclaims any obligation to verify these numbers or to update or revise the performance numbers.
Past performance is not necessarily indicative of future returns.
***
The views expressed in this article are those of the author(s) and do not necessarily reflect the views of AlphaWeek or its publisher, The Sortino Group
© The Sortino Group Ltd
All Rights Reserved. No part of this publication may be reproduced, stored in a retrieval system or transmitted in any form or by any means, electronic, mechanical, photocopying, recording or scanning or otherwise, except under the terms of the Copyright, Designs and Patents Act 1988 or under the terms of a licence issued by the Copyright Licensing Agency or other Reprographic Rights Organisation, without the written permission of the publisher. For more information about reprints from AlphaWeek, click here.