


Kettera Strategies Heat Map - March 2020
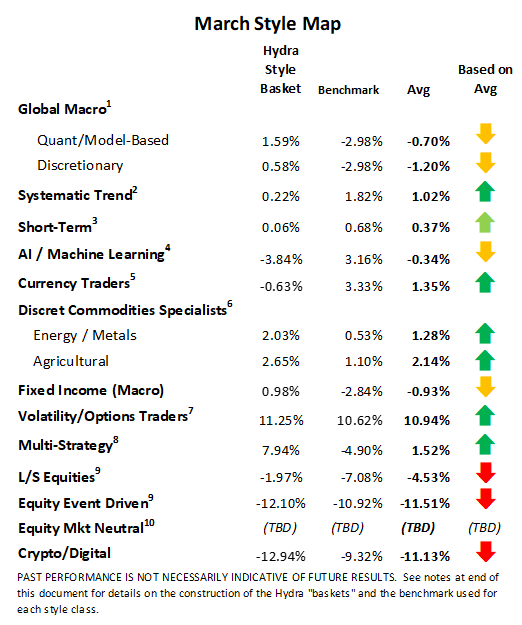
While in February, long convexity and relative value volatility strategies weathered the turmoil well, in March they exceeded all expectations. Many of the programs, both on Hydra and off, posted their best month since inception. Simply put, most of these strategies focus on volatility relating to the equities markets, and the equities markets served up a lot of it in March.
Discretionary commodities managers also generally excelled during the month. Those focused on energy and other industrial commodities, primarily base metals, appeared to call the collapse in both correctly during the month. The more profitable agricultural traders – particularly relative value and spread traders – benefitted from demand destruction and short positioning in corn, in particular. Overall, however, discretionary ag specialists had mixed results as corn and soybeans fell while other products rallied.
Many discretionary global macro strategies redeemed themselves as fundamental factors that began building in late January (or earlier) blew up and accelerated profits in multiple themes. The more successful programs were short base metals and energy (as Chinese demand was destroyed) and long US fixed income. A fortunate few even caught the “up-down” US dollar moves – the sell-off then ensuing mid-month rally. Quant (or model-driven) macro managers seemed to be less successful on the whole, especially in the equities markets, but many fundamental models still caught many of the moves described above. Some quant strategies also benefitted from long volatility positions. Overall the quants’ results were mixed, with single-digit gains or losses on the month.
Systematic trend programs once again appeared to offer a mixed bag. Most of the managers we track tended to post positive returns, mostly in the fixed income, short term rates, and energy sectors. The equities markets seemed to offer the most challenges across the board, as lingering long positions were stopped out for losses in the first few days of the month. The deciding factor in March as to whether a price-based trend follower was profitable seemed to rest on whether it had an overweighting to short energy and commodities markets, able to get flat (or short) equities quickly enough, or long positions in fixed income and rates.
Short-term and higher-frequency programs once gain generated mixed to net positive returns, given the expanding volatility and quick turnarounds in March in several markets. The markets definitely favored the higher frequency players – particularly those with breakout models (as opposed to mean-reverting systems, much less profitable). Programs with slightly longer holding periods tended to get caught on the wrong side of switchbacks. For most short-term programs, short energy and base metals markets, equities and long VIX volatility positions ruled the day, whereas other sectors such as FX and agricultural grains tended to be less lucrative.
Equities strategies performed badly overall, unsurprisingly, with most returns being even worse than February. Probably the best of the bunch were equity market neutral strategies, where gains in short positions mostly “neutralized” the losses on longs. Most equity long-short managers strategies seemed to suffer from their long-beta biases, for which this style is notorious. (We opine that one reason numbers for this group were not worse was that February had stripped them of many longs.) And, of course, long bias and long only strategies had nowhere to hide, regardless of their sector of focus. Event-driven programs seemed to suffer greatly as they faced ever-widening spreads and more directional positions moved down; the subset of merger arbitrage strategies watched as entire portfolios of deals broke at once.
Most of the AI and machine learning-based strategies we track did not perform well in March. But this may make intuitive sense given how they function: These models are fed enormous amounts of data, looking for recurring patterns and relationships, and then try to “learn” which patterns can apply to current conditions and position things accordingly. When an unprecedented event occurs with unusual speed, with somewhat unprecedented reactions and remedies, the historical data offers nothing instructive. We note that we did not see huge losses, and all strategies easily outperformed the equities markets, but the AI and ML programs were still generally negative on the month.
**********
Footnotes:
For the “style classes” and “baskets” presented in this letter: The “style baskets” referenced above were created by Kettera for research purposes to track the category and are classifications drawn by Kettera Strategies in their review of programs on and for the Hydra Platform. The arrows represent the style basket’s overall performance for the month (e.g. the sideways arrow indicates that the basket was largely flat overall, a solid red down arrow indicates the basket (on average) was largely negative compared to most months, etc.). The “style basket” for a class is created from monthly returns (net of fees) of programs that are either: programs currently or formerly on Hydra; or under review with an expectation of being added to Hydra. The weighting of a program in a basket depends upon into which of these three groups the program falls. Style baskets are not investible products or index products being offered to investors. They are meant purely for analysis and comparison purposes. These also were not created to stimulate interest in any underlying or associated program. Nonetheless, as these research tools may be regarded to be “hypothetical” combinations of managers, hypothetical performance results have many inherent limitations, some of which are described below. No representation is being made that any product or account will achieve profits or losses similar to those shown. In fact, there are frequently sharp differences between hypothetical performance results and the actual results subsequently achieved by any particular trading program. One of the limitations of hypothetical results is that they are generally prepared with the benefit of hindsight. In addition, hypothetical trading does not involve financial risk, and no hypothetical trading record can completely account for the impact of financial risk in actual trading. There are numerous other factors related to the markets in general or to the implementation of any specific trading program which cannot be fully accounted for in the preparation of hypothetical performance results and all of which can adversely affect actual trading results.
Benchmark sources:
1-The Hedge Fund Intelligence Global Macro Index and HFI Currency Index
2-The Societe Generale Trend Index and SG CTA Index
3-The Societe General Short-term Traders Index: (same link as above)
4-The Eurekahedge AI Hedge Fund Index
5-The BarclayHedge Currency Traders Index and BTOP FX Traders Index
6- S&P GSCI Metals & Energy Index and S&P GSCI Ag Commodities Index
7-The CBOE Eurekahedge Relative Value Volatility Hedge Fund Index
8-The Eurekahedge-Mizuho Multi-Strategy Index: (See above)
9-The Eurekahedge Long Short Equities Hedge Fund Index: (See above)
10-Blend of BarclayHedge Equity Market Neutral Index with Eurekahedge Equity Mkt Neutral Index (see link above)
Indices and other financial benchmarks shown are provided for illustrative purposes only, are unmanaged, reflect reinvestment of income and dividends and do not reflect the impact of advisory fees. Index data is reported as of date of publication and may be a month-to-date estimate if all underlying components have not yet reported. The index providers may update their reported performance from time to time. Kettera disclaims any obligation to verify these numbers or to update or revise the performance numbers.
***
The views expressed in this article are those of the author and do not necessarily reflect the views of AlphaWeek or its publisher, The Sortino Group
© The Sortino Group Ltd
All Rights Reserved. No part of this publication may be reproduced, stored in a retrieval system or transmitted in any form or by any means, electronic, mechanical, photocopying, recording or scanning or otherwise, except under the terms of the Copyright, Designs and Patents Act 1988 or under the terms of a licence issued by the Copyright Licensing Agency or other Reprographic Rights Organisation, without the written permission of the publisher. For more information about reprints from AlphaWeek, click here.