


Kettera Strategies Heat Map - March 2022
Systematic Trend Following
Longer-term trend following had one of its best months in the last 20 years. Increasing inflation has overwhelmed attempts to compress volatility and trends are free to run. The best performing markets were long energies and products, followed by short positions in fixed income and rates. Long USD, particularly against the Euro and JPY, was a commonly profitable trade. Equities were mixed with an initial sell-off due to war fears in the Ukraine, replaced by a mid-month rally due to general optimism that the war wasn’t going to immediately worsen. Most programs fell into the range of slightly positive to slightly negative in equities.
Quant Global Macro
In contrast to systematic trend programs (above), there was much more variance across quantitative global macro programs. Overall, however, this style bucket was positive. The most profitable themes common to most programs were short positions in short-term rates and bonds and long USD against the JPY and Euro. And commodities were also a theme. In FX, some programs profited from going long the commodities-based currencies (e.g. AUD, MXN and ZAR) versus the USD. For those managers that trade commodities themselves, long petroleum and products were the strongest trades. Trading in metals and grains was mixed. Equities trading was mixed - it was a choppy month with few programs nimble enough to catch the mid-month reversal.
Commodity Specialists – Ag Markets
Grains and livestock trading was mixed in March, depending on whether you were primarily directional or using neutral spreads. Long directional and long-biased spreads in corn were the most profitable trades. In the wheat market, March was a month for the history books. Starting in late February and spiling into March, ignited by the Ukraine conflict, the wheat complex experienced one of the most volatile months ever, with the front contracts in Chicago wheat trading limit up on several consecutive days. This blew out some wheat spread traders: Spread traders who were short the front wheat contract and long the back contracts were caught in an historic short squeeze. There were also some good directional trends in softs like cotton and coffee, although cocoa was choppy and erratic, incurring losses for some managers.
Commodity Specialists - Industrial Commodities (energy and metals)
Industrial Commodities managers were generally profitable in March, with both relative value spreads and directional strategies generally performing well, although there were a few outliers in systematic energy spreads trading. Directional long and long-biased spreads positions in energies and related products performed best. Directional and long-biased spread trading in Nat Gas was particularly profitable. Spread strategies in base metals outperformed similar positions in precious metals where returns were mixed. Some managers that profited from long gold lost a good portion of it in short silver positions. Although industrial metals programs typically had some kind of nickel exposure, the LME’s week-long suspension in nickel and canceled nickel trades on March 8 didn’t dramatically affect performance.
Short-Term Strategies
Higher-frequency and short-term programs can include a myriad of strategies – including breakout, short-term trend/momentum, countertrend strategies. While clients tend to focus more on the breakout and/or momentum techniques, in March it was the trend/momentum strategies that stood out. Nearly all market sectors yielded positive results – making March one of the best months for short-term trading in years. Currencies comprised the best sector for nearly every ST manager that includes this sector. The runner-up was either fixed income or equities indices, depending on the manager.
Discretionary Global Macro
Discretionary Global Macro also had a solid month in March, driven by long petroleum and products positions, short positions in short-term rates and bonds, and long USD versus the JPY and Euro. A few programs made outsized gains being long precious metals, particularly gold and silver. Strategies based on rising inflation and continued central bank and US Fed rate hikes performed particularly well.
***********
Footnotes:
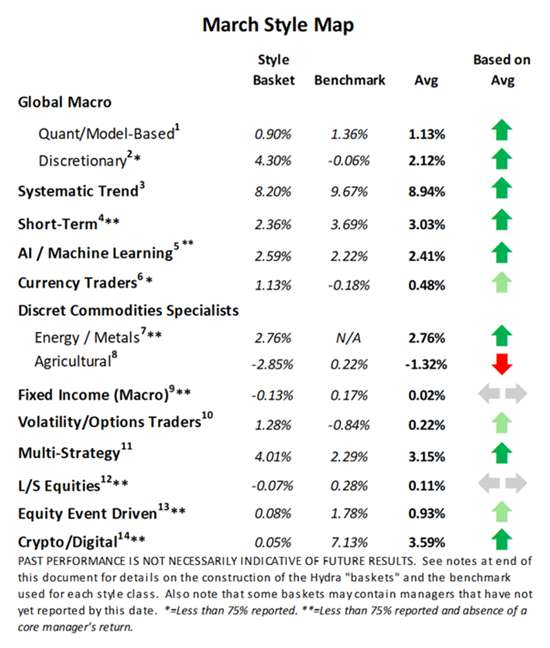
For the “style classes” and “baskets” presented in this letter: The “style baskets” referenced above were created by Kettera for research purposes to track the category and are classifications drawn by Kettera Strategies in their review of programs on and for the Hydra Platform. The arrows represent the style basket’s overall performance for the month (e.g. the sideways arrow indicates that the basket was largely flat overall, a solid red down arrow indicates the basket (on average) was largely negative compared to most months, etc.). The “style basket” for a class is created from monthly returns (net of fees) of programs that are either: programs currently or formerly on Hydra; or under review with an expectation of being added to Hydra. The weighting of a program in a basket depends upon into which of these three groups the program falls. Style baskets are not investible products or index products being offered to investors. They are meant purely for analysis and comparison purposes. These also were not created to stimulate interest in any underlying or associated program. Nonetheless, as these research tools may be regarded to be “hypothetical” combinations of managers, hypothetical performance results have many inherent limitations, some of which are described below. no representation is being made that any product or account will achieve profits or losses similar to those shown. in fact, there are frequently sharp differences between hypothetical performance results and the actual results subsequently achieved by any particular trading program. one of the limitations of hypothetical results is that they are generally prepared with the benefit of hindsight. in addition, hypothetical trading does not involve financial risk, and no hypothetical trading record can completely account for the impact of financial risk in actual trading. there are numerous other factors related to the markets in general or to the implementation of any specific trading program which cannot be fully accounted for in the preparation of hypothetical performance results and all of which can adversely affect actual trading results..
Benchmark sources:
- Blend of Eurekahedge Macro Hedge Fund Index and BarclayHedge Global Macro Index
- The Eurekahedge Macro Index
- The Société Générale Trend CTA Index
- The Société Générale Short-term Traders Index
- The Barclay Hedge Currency Traders Index
- Blend of Bridge Alternatives Commodity Hedge Fund Index and Barclay Discretionary Traders Index (for February only the Barclay index was used as the Bridge index was unavailable.)
- The Barclay Agricultural Traders Index: (same link as above)
- The Eurekahedge Commodity Hedge Fund Index
- Blend of CBOE Eurekahedge Relative Value Volatility Hedge Fund Index and CBOE Eurekahedge Long Volatility Index (same link)
- Blend of Eurekahedge Multi Strategy Asset Weighted Index and Barclay Hedge Fund Multi Strategy Index
Indices and other financial benchmarks shown are provided for illustrative purposes only, are unmanaged, reflect reinvestment of income and dividends and do not reflect the impact of advisory fees. index data is reported as of date of publication and may be a month-to-date estimate if all underlying components have not yet reported. the index providers may update their reported performance from time to time. Kettera disclaims any obligation to verify these numbers or to update or revise the performance numbers.
***
The views expressed in this article are those of the author and do not necessarily reflect the views of AlphaWeek or its publisher, The Sortino Group
© The Sortino Group Ltd
All Rights Reserved. No part of this publication may be reproduced, stored in a retrieval system or transmitted in any form or by any means, electronic, mechanical, photocopying, recording or scanning or otherwise, except under the terms of the Copyright, Designs and Patents Act 1988 or under the terms of a licence issued by the Copyright Licensing Agency or other Reprographic Rights Organisation, without the written permission of the publisher. For more information about reprints from AlphaWeek, click here.