


Kettera Strategies Heat Map - May 2022
Systematic Trend Following
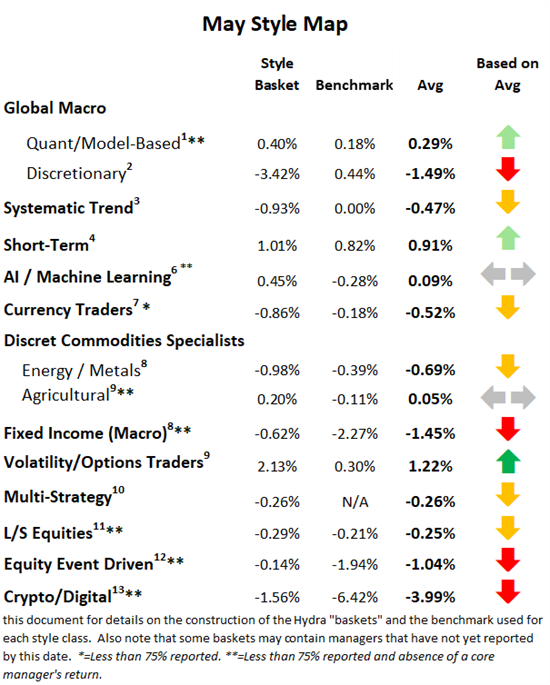
After one of the strongest months in years in April, long-term trend followers were down in May. The best performing markets were found in the energy sector and in the so-called “commodities-linked” currencies. The few winning trades included long positions in crude oil, petroleum products, natural gas, and European power; also long commodity-linked currencies against the USD, such as the Mexican Peso and Brazilian real. Nearly all of the other sectors were choppy and lacked direction, however, and resulted in negative overall performance. The US dollar’s reversal from a long bullish against G10 currencies was one of the largest setbacks – the most notable being EUR/USD. Trading in equities indices was difficult for longer-term models as the first half of the month was down while a sharp rally in the second half suddenly hit stops and/or reversed positions. Other losing positions for most programs included long grains and long base and precious metals. Fixed Income trading was mixed as interest rates declined mid-month and spun short positions in rates and bonds around.
Currency Specialists
Following a positive April for most FX strategies, currency programs were generally down in May, as the USD’s long strengthening trend vs. G10 currencies, namely the Euro and Yen, reversed. Macro headwinds were responsible for the USD weakening, including growing recession fears in the US, and US interest rates falling during the second half of May. This posed a difficult environment for longer term currency positions, while short-term trading was choppy and also difficult for both systematic and discretionary managers. Commodity currencies did well against the USD, including Mexico, Brazil, S. Africa, Australia and Canada.
Quantitative Macro
In contrast to their purely price-driven cousins, the systematic trend followers, Quant Macro strategies (which rely more on fundamental and economic inputs) were generally positive in May. Those macro programs that also trade commodities seemed to fare the best, as most were buoyed by strong performance in energy markets. Most programs also saw small gains in FX trading. Equities and Fixed Income performance was flat to slightly negative as several mid-month reversals proved just as difficult to trade for econometric-based as well as price-based models. In commodities, those programs trading ag markets suffered losses due to choppy markets and conflicting economic reports, although these were more than mitigated by long positions in energy markets.
Commodity Specialists – Agricultural Traders
Ag and livestock trading in May was mixed, characterized by choppy/sideways markets, most notably in corn and soybeans. Grains trading was particularly tricky, as bullish conditions coming into May were met with macro headwinds caused by uncertain demand out of China, improving weather conditions in the US, and somewhat optimistic crop and yield reports. Managers needed to be agile and shorten their outlooks in order to navigate the headline-driven markets quickly. Livestock trading was also range-bound and difficult, and programs generally reduced their exposures until a clearer picture develops – which most traders are expecting by Q3 or Q4.
Industrial Commodities – Energy and Metals
Most industrial commodities (metals and energy markets) programs were down in May, but this depended on the type of strategy. Base and precious metals strategies suffered, primarily because the strong bullish fundamentals in both base and precious metals were put in check by multiple macro headwinds, including a strong USD, strict covid lockdowns in China, and slower global growth and recession fears. More generalist programs that trade both metals and energies across diversified strategies were also negative. Relative value and short-term strategies both suffered. All that said, pure energy traders fared better as the energy markets continued their march higher, notably US natural gas, crude and petroleum products.
**********
Footnotes:
For the “style classes” and “baskets” presented in this letter: The “style baskets” referenced above were created by Kettera for research purposes to track the category and are classifications drawn by Kettera Strategies in their review of programs on and for the Hydra Platform. The arrows represent the style basket’s overall performance for the month (e.g. the sideways arrow indicates that the basket was largely flat overall, a solid red down arrow indicates the basket (on average) was largely negative compared to most months, etc.). The “style basket” for a class is created from monthly returns (net of fees) of programs that are either: programs currently or formerly on Hydra; or under review with an expectation of being added to Hydra. The weighting of a program in a basket depends upon into which of these three groups the program falls. Style baskets are not investible products or index products being offered to investors. They are meant purely for analysis and comparison purposes. These also were not created to stimulate interest in any underlying or associated program. Nonetheless, as these research tools may be regarded to be “hypothetical” combinations of managers, hypothetical performance results have many inherent limitations, some of which are described below. No representation is being made that any product or account will achieve profits or losses similar to those shown. In fact, there are frequently sharp differences between hypothetical performance results and the actual results subsequently achieved by any particular trading program. One of the limitations of hypothetical results is that they are generally prepared with the benefit of hindsight. In addition, hypothetical trading does not involve financial risk, and no hypothetical trading record can completely account for the impact of financial risk in actual trading. There are numerous other factors related to the markets in general or to the implementation of any specific trading program which cannot be fully accounted for in the preparation of hypothetical performance results and all of which can adversely affect actual trading results.
Benchmark sources:
1- Blend of Hedge Fund Intelligence Global Macro Index and Eurekahedge Macro Hedge Fund Index
2- The Hedge Fund Intelligence Global Macro Beta Index: (same link as above)
3- The Societe Generale Trend Index
4- The Societe Generale Short-term Traders Index: (same link as above)
5- The Eurekahedge AI Hedge Fund Index
6- The Barclay Hedge Currency Traders Index
7- Blend of Barclay Discretionary Traders Index and Bridge Alternatives Commodity Hedge Fund Index
8- The Barclay Agricultural Traders Index: (same link as above)
9- The Barclay Fixed Income Arbitrage Index: (same link as above)
10- Blend of Eurekahedge Relative Value Volatility Hedge Fund Index and Eurekahedge Long Volatility Index
11- Blend of Eurekahedge Asset Weighted Multi Strategy Asset Weighted Index and Barclay Hedge Fund Multi Strategy Index
12- Eurekahedge Event-Driven Hedge Fund Index
13- The Barclay Hedge Crypto Traders Index
Indices and other financial benchmarks shown are provided for illustrative purposes only, are unmanaged, reflect reinvestment of income and dividends and do not reflect the impact of advisory fees. Index data is reported as of date of publication and may be a month-to-date estimate if all underlying components have not yet reported. The index providers may update their reported performance from time to time. Kettera disclaims any obligation to verify these numbers or to update or revise the performance numbers.
***
The views expressed in this article are those of the author and do not necessarily reflect the views of AlphaWeek or its publisher, The Sortino Group
© The Sortino Group Ltd
All Rights Reserved. No part of this publication may be reproduced, stored in a retrieval system or transmitted in any form or by any means, electronic, mechanical, photocopying, recording or scanning or otherwise, except under the terms of the Copyright, Designs and Patents Act 1988 or under the terms of a licence issued by the Copyright Licensing Agency or other Reprographic Rights Organisation, without the written permission of the publisher. For more information about reprints from AlphaWeek, click here.