

Kettera Strategies Heat Map - November 2020
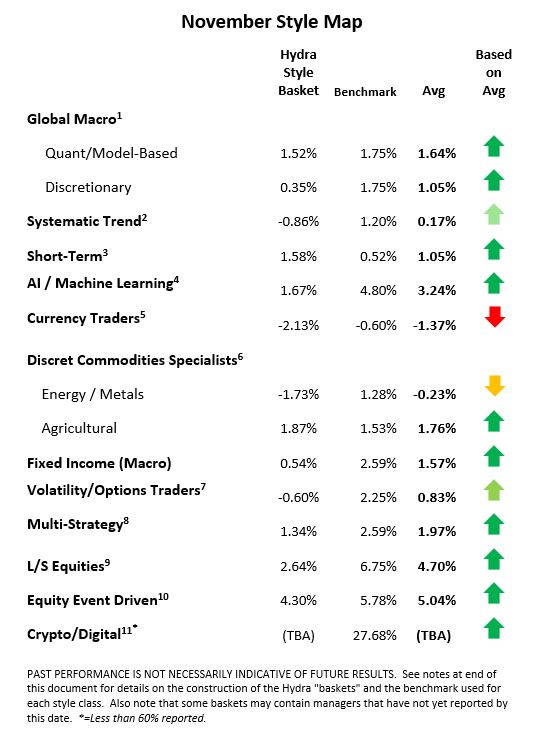
Unlike October, where the bulk of discretionary macro managers returned slightly negative numbers, November shows an enormously wide range of returns. Long equities, not surprisingly, was the common theme among the most profitable managers. Many so-called ‘pandemic loser’ stocks jumped strongly, in energy and financials in particular. Many also sold USD to buy many “risk on” currencies – e.g. the South African rand and Brazilian real. Those less fortunate appeared to be more focused on fixed income vs equities, getting whipsawed by post-US Election volatility.
November also appeared to be a generally positive month for most model-based macro strategies. While the higher performers here also tended to be long equities, this was to a lesser degree than their discretionary brethren above, and fixed income tended to be more lucrative. Unless the program traded ag markets, the commodities markets tended to be a mixed bag (we detected difficulty with precious metals). We also didn’t see as much profits from emerging currencies.
Most of the systematic trend programs we track were positive for the month, largely thanks to long equities positions and long industrial commodities. Of those veteran trend followers that ended the month slightly negative, the setbacks came largely from the longer-term systems. Signals had them still short equities indices and short industrial commodities (e.g. crude oil and industrial metals) coming into the month and US Election.
As we’ve often noted, returns in the short-term and higher frequency traders category can vary widely – and November was no exception. Positive performers tended to have intraday- to 2-3 day holding periods, and found profits in nearly every sector except for FX and precious metals. Those programs on the more negative end of the spectrum tended to have longer holding periods and where equities were the only bright light.
The AI/Machine Learning programs category was perhaps the best of the Tactical (futures and derivatives trading) programs we track. Given how different learning processes are trained, and the wide variance in implementation, it’s difficult to strike a common theme across these programs. Nonetheless, we do note that many, if not most, of the outperformers capitalized on long equities and short fixed income.
Despite all the concern surrounding the U.S. Election, the long-short equities sector posted one of its best months in recent memory (at least by our calculation). While profits from the long side were not surprising, many of the managers we follow also exploited selloffs in “Covid friendly” stocks (e.g., certain tech names).
**********
Footnotes:
For the “style classes” and “baskets” presented in this letter: The “style baskets” referenced above were created by Kettera for research purposes to track the category and are classifications drawn by Kettera Strategies in their review of programs on and for the Hydra Platform. The arrows represent the style basket’s overall performance for the month (e.g. the sideways arrow indicates that the basket was largely flat overall, a solid red down arrow indicates the basket (on average) was largely negative compared to most months, etc.). The “style basket” for a class is created from monthly returns (net of fees) of programs that are either: programs currently or formerly on Hydra; or under review with an expectation of being added to Hydra. The weighting of a program in a basket depends upon into which of these three groups the program falls. Style baskets are not investible products or index products being offered to investors. They are meant purely for analysis and comparison purposes. These also were not created to stimulate interest in any underlying or associated program. Nonetheless, as these research tools may be regarded to be “hypothetical” combinations of managers, hypothetical performance results have many inherent limitations, some of which are described below. No representation is being made that any product or account will achieve profits or losses similar to those shown. In fact, there are frequently sharp differences between hypothetical performance results and the actual results subsequently achieved by any particular trading program. One of the limitations of hypothetical results is that they are generally prepared with the benefit of hindsight. In addition, hypothetical trading does not involve financial risk, and no hypothetical trading record can completely account for the impact of financial risk in actual trading. There are numerous other factors related to the markets in general or to the implementation of any specific trading program which cannot be fully accounted for in the preparation of hypothetical performance results and all of which can adversely affect actual trading results.
Benchmark sources:
1-The Hedge Fund Intelligence Global Macro Index and HFI Currency Index
2-The Societe Generale Trend Index and SG CTA Index
3-The Societe General Short-term Traders Index: (same link as above)
4-The Eurekahedge AI Hedge Fund Index
5-The BarclayHedge Currency Traders Index and BTOP FX Traders Index
6- S&P GSCI Metals & Energy Index and S&P GSCI Ag Commodities Index
7-The CBOE Eurekahedge Relative Value Volatility Hedge Fund Index
8-The Eurekahedge-Mizuho Multi-Strategy Index: (See above)
9-The Eurekahedge Long Short Equities Hedge Fund Index: (See above)
10-Blend of BarclayHedge Equity Market Neutral Index with Eurekahedge Equity Mkt Neutral Index (see link above)
11 – Barclay Crypto Traders Index.
Indices and other financial benchmarks shown are provided for illustrative purposes only, are unmanaged, reflect reinvestment of income and dividends and do not reflect the impact of advisory fees. Index data is reported as of date of publication and may be a month-to-date estimate if all underlying components have not yet reported. The index providers may update their reported performance from time to time. Kettera disclaims any obligation to verify these numbers or to update or revise the performance numbers.
***
The views expressed in this article are those of the author and do not necessarily reflect the views of AlphaWeek or its publisher, The Sortino Group
© The Sortino Group Ltd
All Rights Reserved. No part of this publication may be reproduced, stored in a retrieval system or transmitted in any form or by any means, electronic, mechanical, photocopying, recording or scanning or otherwise, except under the terms of the Copyright, Designs and Patents Act 1988 or under the terms of a licence issued by the Copyright Licensing Agency or other Reprographic Rights Organisation, without the written permission of the publisher. For more information about reprints from AlphaWeek, click here.