


Kettera Strategies Heat Map - September 2021
Volatility/Options Strategies
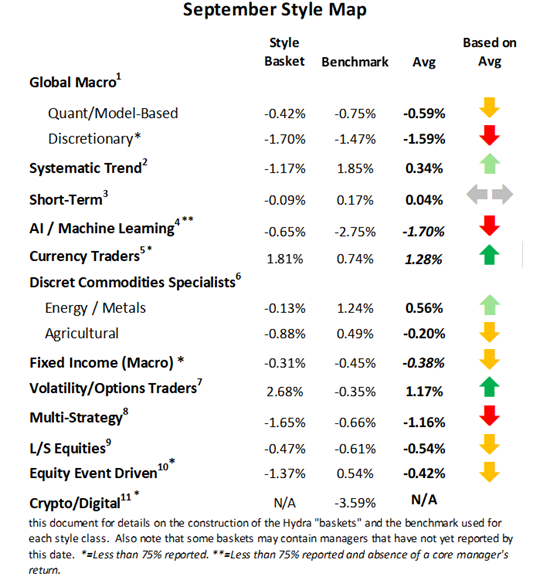
It was a big month for most of the long volatility and relative value (RV) volatility managers we follow - perhaps their best in nearly 1½ years. Even those RV strategies that allow for occasional, limited net shorting of vol ended positively. (For short vol traders, strategies we do not typically consider, it was a muted month although, surprisingly, not a negative one.) The vast majority of the long vol and RV vol strategies we follow focus on the equities indices and equity volatility products.
Currency Strategies
As the general volatility in most G10 currencies edged higher - particularly in the second half of the month - this created opportunities across all time frames and trading styles (both price- and fundamentals-based). The most profitable positions we are seeing were largely short G10 vs long USD or long JPY. As for emerging currencies, when money flocks to the USD this tends to translate to reduced risk appetite for emerging units – which as a group clocked in their worst performing month since March.
Systematic Trend Strategies
Although as a style sector overall performance was slightly negative on average, September showed some of the widest dispersion among returns that we have seen in one month in a long time. (This demonstrates that, contrary to popular belief, differentiation does exist among trend followers.) Those longer-term systems that were profitable on the month generally captured the moves in FX (stronger USD) and commodities (long energies, long softs, short precious metals), while long equities indices and long bond markets posed the biggest challenges, two trends that reversed in September. A manager’s performance was largely dependent upon how these sectors were under/over -weighted.
Commodities – Metals & Energy Specialists
The energy markets were the hotspot in September, offering more opportunities than usual given resurgent prices and volatility. Most of the specialists we follow trade the industrial commodities on a relative value / spread basis, not outright directionally. And this yielded several opportunities for Nat-Gas traders using bull spreads and relative value spreads in Brent/Crude markets. Volatility was also on the rise in the metals markets, fuelled by global macroeconomic concerns - largely involving China. Most base metals traders, both technical and fundamental, had a challenging month, while precious metals traders fared better and were more prepared to trade from the short side of markets.
**********
Footnotes:
For the “style classes” and “baskets” presented in this letter: The “style baskets” referenced above were created by Kettera for research purposes to track the category and are classifications drawn by Kettera Strategies in their review of programs on and for the Hydra Platform. The arrows represent the style basket’s overall performance for the month (e.g. the sideways arrow indicates that the basket was largely flat overall, a solid red down arrow indicates the basket (on average) was largely negative compared to most months, etc.). The “style basket” for a class is created from monthly returns (net of fees) of programs that are either: programs currently or formerly on Hydra; or under review with an expectation of being added to Hydra. The weighting of a program in a basket depends upon into which of these three groups the program falls. Style baskets are not investible products or index products being offered to investors. They are meant purely for analysis and comparison purposes. These also were not created to stimulate interest in any underlying or associated program. Nonetheless, as these research tools may be regarded to be “hypothetical” combinations of managers, hypothetical performance results have many inherent limitations, some of which are described below. No representation is being made that any product or account will achieve profits or losses similar to those shown. In fact, there are frequently sharp differences between hypothetical performance results and the actual results subsequently achieved by any particular trading program. One of the limitations of hypothetical results is that they are generally prepared with the benefit of hindsight. In addition, hypothetical trading does not involve financial risk, and no hypothetical trading record can completely account for the impact of financial risk in actual trading. There are numerous other factors related to the markets in general or to the implementation of any specific trading program which cannot be fully accounted for in the preparation of hypothetical performance results and all of which can adversely affect actual trading results.
Benchmark sources:
1-The IndexIQ Hedge Global Macro Beta Index
2-The Societe Generale Trend Index and SG CTA Index
3-The Societe General Short-term Traders Index: (same link as above)
4-The Eurekahedge AI Hedge Fund Index
5-The BarclayHedge Currency Traders Index and BTOP FX Traders Index
6- The BarclayHedge Discretionary Traders Index and Barclay Ag Traders Index and NilssonHedge Commodities CTA Index
7-The CBOE Eurekahedge Relative Value Volatility Hedge Fund Index
8-The Eurekahedge-Mizuho Multi-Strategy Index: (See above)
9-The Eurekahedge Long Short Equities Hedge Fund Index: (See above)
10-Blend of http://www.barclayhedge.com/ with Eurekahedge Equity Mkt Neutral Index (see link above)
11 – Barclay Crypto Traders Index.
Indices and other financial benchmarks shown are provided for illustrative purposes only, are unmanaged, reflect reinvestment of income and dividends and do not reflect the impact of advisory fees. Index data is reported as of date of publication and may be a month-to-date estimate if all underlying components have not yet reported. The index providers may update their reported performance from time to time. Kettera disclaims any obligation to verify these numbers or to update or revise the performance numbers.
***
The views expressed in this article are those of the author and do not necessarily reflect the views of AlphaWeek or its publisher, The Sortino Group
© The Sortino Group Ltd
All Rights Reserved. No part of this publication may be reproduced, stored in a retrieval system or transmitted in any form or by any means, electronic, mechanical, photocopying, recording or scanning or otherwise, except under the terms of the Copyright, Designs and Patents Act 1988 or under the terms of a licence issued by the Copyright Licensing Agency or other Reprographic Rights Organisation, without the written permission of the publisher. For more information about reprints from AlphaWeek, click here.