Private Equity Chart of the Month: Refinitiv Private Equity Buyout Index vs S&P 500
Much has been written about the merits of a private equity allocation. Dissenters say that it’s just not worth it – the alleged ‘illiquidity premium’ that private equity claims to offer either doesn’t exist at all or isn’t enough to justify locking your money up for a decade (or more).
That said, it’s a decades-old, multi-trillion dollar industry, managing money for some of the world’s largest, most sophisticated investors, so someone’s doing something right. Either way, for our private equity chart of the month this month, we figured we’d have a look at some data to see what’s going on.
DSC Quantitative Group in Chicago partnered with Refinitiv a good few years ago now to produce a buyout index product; the index, called the Refinitiv Private Equity Buyout Index, uses public market equivalents to attempt to replicate the Refinitiv Buyout Benchmark Index, which uses private company valuations in the United States to show the performance of the private equity industry in the United States. We plugged the data into AlphaBot to see what’s what.
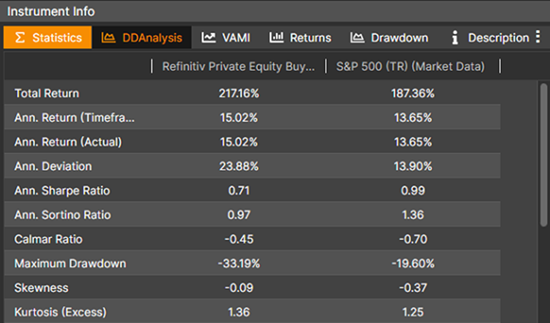
There’s good news and bad news for private equity bulls. The good news is that since the index’s inception in 2014, the private equity folks have been largely outperforming the S&P 500, with the lone exception of February / March 2020, until April this year. The bad news is that the private equity index has underperformed equities since the start of 2014, at the inception of the Refinitiv index. Sharpe and Sortino ratios are both worse for the buyout index. PE has a larger maximum drawdown, lower annual returns and lower volatility (something the PE folks claim is a reason to allocate to the asset class).
Figure 1: Refinitiv Private Equity Buyout Index vs S&P 500, 01/2014 through 08/2022, VAMI
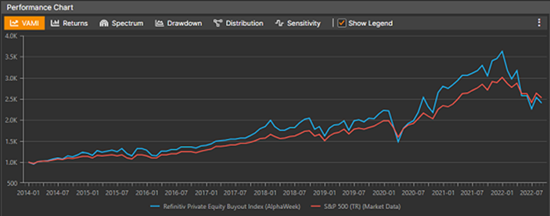
Figure 1a: Refinitiv Private Equity Buyout Index vs S&P 500, 01/2014 through 08/2022, General Stats
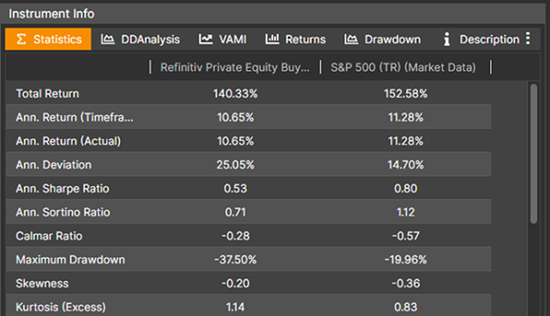
Source: AlphaBot
If this chart was published in early April, with data through the end of March, it would have been very different. The Buyout index was delivering an annual return of 15% then, although the Sharpe and Sortino ratios were still better in the S&P 500.
Figure 2: Refinitiv Private Equity Buyout Index vs S&P 500, 01/2014 through 03/2022, VAMI
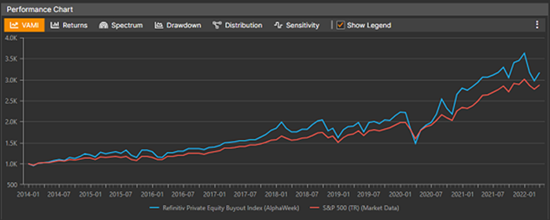
Figure 2a: Refinitiv Private Equity Buyout Index vs S&P 500, 01/2014 through 03/2022, General Stats
Source: AlphaBot
Using an index like this for comparative purposes can hardly be described as ‘real life’ – no LP has exposure to the entire US private equity industry. But it’s interesting to see how a market benchmark performs. It’s been a bumpy year for investors in all asset classes and until the past six months, U.S. private equity has been outperforming its large cap public cousins. Whether this recent under performance will persist, or whether U.S. private equity can resume it’s previous sustained higher performance, remains to be seen.
**********
Dmitri Alexeev is Founder and CEO of AlphaBot, a collaborative platform for alternative investment research
***
The views expressed in this article are those of the author and do not necessarily reflect the views of AlphaWeek or its publisher, The Sortino Group
© The Sortino Group Ltd
All Rights Reserved. No part of this publication may be reproduced, stored in a retrieval system or transmitted in any form or by any means, electronic, mechanical, photocopying, recording or scanning or otherwise, except under the terms of the Copyright, Designs and Patents Act 1988 or under the terms of a licence issued by the Copyright Licensing Agency or other Reprographic Rights Organisation, without the written permission of the publisher. For more information about reprints from AlphaWeek, click here.