


2022 CTA Index Performance Review
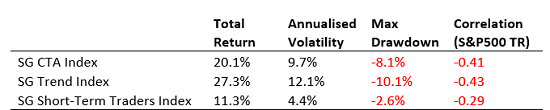
CTAs of all varieties completed a very strong positive year’s performance in 2022, as summarised in Exhibit 1. The SG CTA Index finished the year up 20.1%; the best annual gain since we began calculating the index in 2000, and the fourth consecutive positive year for managed futures strategies. As in previous years trend-followers led performance in 2022, and the SG Trend Index also finished the year with a record return 27.3%. The total return over the last four years for CTA Index was 39.8%, and for the Trend Index 61.3%, showing that managed futures strategies have clearly benefitted from the market environment. Despite the recent high absolute return, the annualised volatility remains approximately equal to previous years and the historical average, meaning that CTA risk-adjusted returns have been high, especially for trend-followers which have realised a 2022 Sharpe ratio greater than 1.
Exhibit 1: 2022 CTA Summary Performance
Source: SG Prime Services, Bloomberg
Shorter-term CTA strategies also did well in 2022 as the SG Short-Term Traders Index equalled its best yearly return up 11.3% and delivered the best risk-adjusted performance of our various CTA indices for the year. The short-term CTAs have historically exhibited low pairwise correlations to each other, which once again kept the index volatility low at around 4%. The correlation of CTAs to equities markets, such as the S&P500 for example, was negative in 2022, which was a significant change from the low, but slightly positive, correlation we have observed over the last five years.
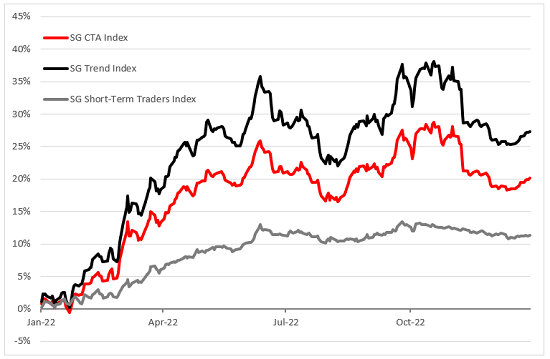
CTA performance was strongest in the first half of 2022, as detailed in Exhibit 2. All the CTA indices enjoyed a run-up in the first six months of the year; the first obvious peak was in the middle of June 2022 when the CTA Index stood positive 25.9% YTD. Subsequently CTAs experienced a drawdown and recovery in the second half of 2022 before reaching new highs again in October, when the CTA Index was up 28.7% YTD. A final small drawdown and slight recovery closed out the year.
Exhibit 2: CTA Index Performance in 2022
Source: SG Prime Services
2022 CTA PERFORMANCE DISPERSION
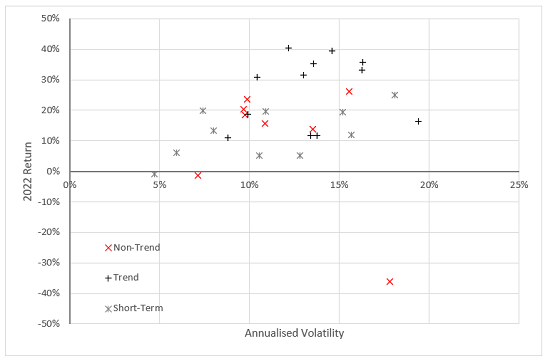
We have written previously that individual CTA performance dispersion is often greatest during periods of positive performance, and 2022 was no exception, as depicted in Exhibit 3 showing the range of all the individual CTA strategies in our indices. Overall 27 out of the total 30 individual CTA programs delivered positive performance in 2022, and all of the trend-followers were strongly positive with a range of returns from 11% to 40%. Non-trend strategies such as fundamental quant macro and short-term CTA programs, were mostly in positive territory; there were only two small negative returns, and one major outlier with a significant negative return. While much of the dispersion of CTA returns can be attributed to the implementation of different strategies and techniques, the effect of leverage can also be observed and explains some of the differences in individual returns and volatility during the year.
Exhibit 3: CTA Indices Constituent Performance in 2022
Source: SG Prime Services
2022 TREND-FOLLOWING RETURNS
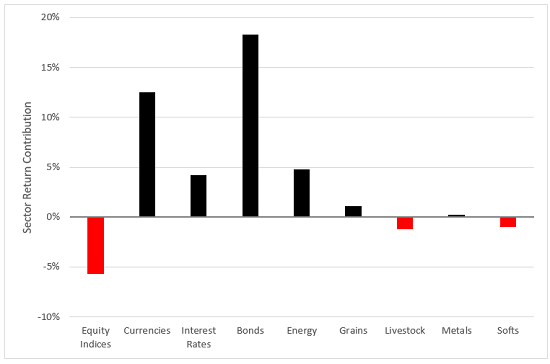
The SG Trend Indicator, our hypothetical trend-following model portfolio, realised a high correlation of 0.9 to the SG Trend Index in 2022. The absolute return was slightly higher, but interestingly the risk-adjusted performance was far lower at nearly half the value, suggesting that real CTA managers added value in the risk management of their portfolios during the year. Using the attribution data from the Trend Indicator as a proxy for the performance drivers for trend-following strategies in 2022, Exhibit 4 illustrates that Fixed Income (bond and interest rate markets), Currencies, and the Energy sector provided the bulk of positive returns. Extended directional moves in these sectors likely provided a good opportunity for trend-following strategies during the year, whereas movements in Equity indices, Livestock, and Softs were harder to capture and contributed small losses to the portfolio. This was a reversal of last year’s performance contributions, and the only consistent area that has provided opportunities for trend-following in the last three years is the Energy complex, highlighting the reason CTAs trade diversified cross asset portfolios as different markets display trends at different times.
Exhibit 4: SG Trend Indicator Performance Attribution by Sector in 2022
Source: SG Prime Services, Bloomberg
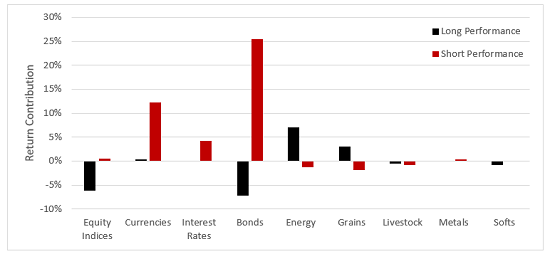
The gains in Bonds and Currencies during 2022 were from downward trends, as revealed in Exhibit 5 which splits the performance attribution into long/short trends during the year. CTA trend-following strategies were able to capture the consistent decline in global government bonds and interest rates, and USD dollar strength that persisted throughout 2022 until Q3. In contrast moves in Equity indices were harder to trade for CTAs, the Trend Indicator’s simple medium-term model was whipsawed in a series of long/short trades as markets moved sideways and resulted in losses to the portfolio from short trades. The area where upwards trends contributed to positive performance was Energy and Grains markets, providing a useful reminder that CTAs are tactical trading strategies that can capture both up and down-market environments.
Exhibit 5: SG Trend Indicator Long/Short Trend Attribution by Sector in 2022
Source: SG Prime Services, Bloomberg
2022 MOMENTUM OPPORTUNITIES
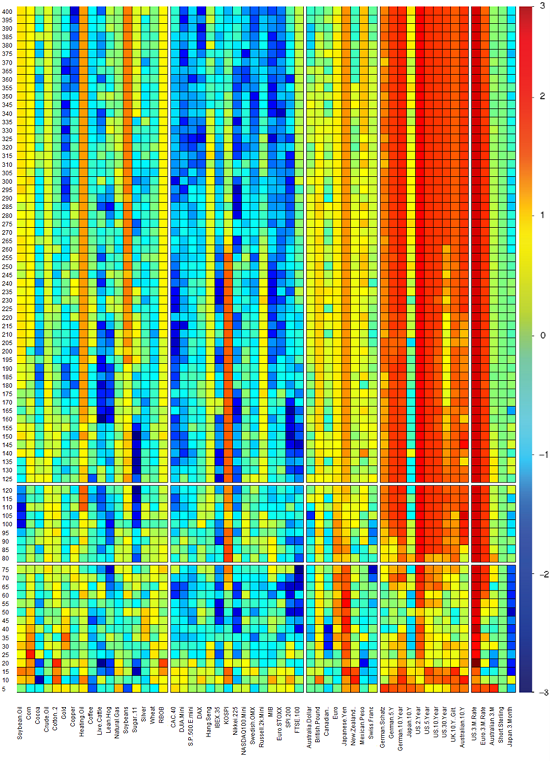
We have generated a heatmap[1] analysis in Exhibit 6 which shows the overall cross-asset opportunities for momentum-based trend-following strategies during 2022. The heatmap shows different time- frames on the vertical, from a short-term 5-day lookback window to very long-term 400-days momentum, applied across global futures markets covering all the main sectors. Warm areas of “heat” (red) indicate positive z-scores which likely provided good opportunities for trend-following, in comparison to “cooler” (blue) which were more challenging to capture trends.
The overall average z-score value across all markets and momentum time frames was 0.22, which is relatively high, and importantly positive, indicating there were opportunities for trend-following strategies last year. The average was slightly higher 0.25 in the 80 to 120-day range which we associate with medium to long-term trend following. The most obvious area of “heat” is the fixed income sector, which provided significant opportunities, the average z-score in bond markets across all time frames was 1.46, and even higher 1.52 in the 80 to 120-day range. The maximum z-score value was 3.22 in the U.S. 3-month interest rate future (Eurodollar), which also had the highest average value 2.57 across all lookback time frames. Not all bond and interest rate markets were so opportune for trend-following, there were a few markets which were far cooler, and the Japan 3-month interest rate future was negative on average.
As we already know the Currency sector also provided good opportunities for trend-following; the average z-score in these markets was positive 0.23, with a good amount of “heat” on display. Elsewhere the heatmap is “cooler” indicating fewer opportunities for trend-following, except for one or two markets in Commodities and Equity indices. Analysing the heatmap across time frames there appears to be little difference between medium and long-term trends, in general the opportunity set is the same, and the average z-score for very long lookbacks up to 400 days are approximately the same as medium-term. In the short-term time frames there do appear to be areas of “warmth” and opportunities for CTA strategies, but this space is very parameter dependant and often changes quickly.
Exhibit 6: Momentum Heatmap Opportunities in 2022
Source: SG Prime Services, Bloomberg
Overall, 2022 was something of a banner year for CTAs, with trend-following programs in particularly performing well, especially in bonds and currencies on the way down and grains and energy on the way up. But what’s equally as important to note as the outperformance in 2022 is that managed futures strategies have largely delivered positive performance in each of the last four years with low correlation to the S&P500 (TR). After the post-Global Financial Crisis lull, CTAs are back to delivering what they are designed to do.
**********
Tom Wrobel is Director, Capital Consulting & Capital Introductions, Prime Services & Clearing at Societe Generale in London
Footnotes
- [1] Please contact Capital Consulting team to learn more about the heatmap momentum z-score model construction methodology
***
The views expressed in this article are those of the author and do not necessarily reflect the views of AlphaWeek or its publisher, The Sortino Group
© The Sortino Group Ltd
All Rights Reserved. No part of this publication may be reproduced, stored in a retrieval system or transmitted in any form or by any means, electronic, mechanical, photocopying, recording or scanning or otherwise, except under the terms of the Copyright, Designs and Patents Act 1988 or under the terms of a licence issued by the Copyright Licensing Agency or other Reprographic Rights Organisation, without the written permission of the publisher. For more information about reprints from AlphaWeek, click here.


