


Kettera Strategies Heat Map - July 2025
For its examination of July, the following highlights four of the various style categories that Kettera covers.
Systematic Trend
Systematic long term trend followers were positive in July with some rather consistent performance attribution across programs. Equity index trading was positive with long exposures in the US, particularly tech-heavy indices such as Nasdaq, and Europe. FX trading was generally negative although there were a few exceptions, with short US dollar exposures losing badly vs. other G10 currencies, particularly the Japanese yen, euro, and GBP. The USD (DXY) rallied over 3% in July buoyed by strong US data and favorable terms on the tariff deals. Systematic positions in fixed income were mixed, as long US short-term rates exposures lost ground (yields rose) – somewhat offset by short exposures in European rates (where yields also rose) on concerns about future growth in national debts. Commodities trading was generally positive, although not without a good deal of volatility and dispersion across the commodities sub-sectors. Trend followers generally found profits in long crude and petroleum products, short grains (corn, soybeans), and long cattle (feeder, live). Metals were a negative contribution for most programs. Not only did long exposures in gold cause modest losses, but July brought an incredibly tumultuous month in copper: Due to mixed messaging on tariffs the base metal dropped 22% on the COMEX exchange in one day, the largest historical single-day drop in that market, and other metals (e.g. Silver, palladium) also got pulled down. Most trend models failed to catch the drop or had light long positions that were obliterated. Mid-range programs with 2- to 4-week holding periods seemed to be the most positive on the month, while the longer-term programs suffered more extreme swings, with big gainers accompanied by a few big losers.
Discretionary Global Macro
The discretionary global macro grouping was negative overall, with several slightly positive programs overwhelmed by a few badly damaged ones. While discretionary macro programs emerged as the heroes of the tariff tantrums earlier in the year, July was definitely a “give back” month. In FX trading, short exposures in USD vs. G5 underperformed as most PMs interpreted weak US economic data and a likely Fed rate cut as reasons to be short, only to be greeted instead by a strong rally in the USD - breaking a 2-month slide. Fixed income trading provided a bright spot as short exposures in European and Asian markets (Germany, Japan) paid off as yields rose. Those few programs we saw carrying long positions in the US 2-Yr rate were punished accordingly as rates rose. Equity positioning seemed to be one of the bright lights for the macro crowd, as long exposures benefited from rallies in the US and Europe. For those managers also trading commodities, long crude was also a winning position, as was short natural gas. Metals were notably negative as long gold exposures suffered with a sell-off in the yellow metal. But the real hit was reserved for those programs long US copper (COMEX) where some managers bought the metal ahead of a presumed 50% tariff on imports; such positioning got smacked hard in the last days of the month as the reality of the tariff proved otherwise. .
Currency Specialists
FX programs were generally positive in July, with systematic strategies outperforming discretionary fundamental managers. Performance hinged more on behavioral forces and risk management than macro calls. In the systematic camp, short-term models seemed to capture the early-month USD rebound—most visibly in USD/JPY, EUR/USD and GBP/USD—via momentum and mean-reversion entries. These exposures were reduced as ranges narrowed later in the month, preserving gains. Mean-reversion and breakout signals in USD/JPY and AUD/USD were good contributors; models armed with some form of regime-identification seemed to sort out the rising noise well. Turning to fundamentals, econometric-based models generally outpaced their discretionary macro peers during the month. Discretionary fundamental books were caught off guard around mid-month (the time of the Japan MoF action), where JPY positions hit stops – turning earlier JPY-cross carry gains into mixed outcomes. In short, price-driven systems (especially those with regime filters) were rewarded; macro bets and unhedged yen-carry exposures were penalized.
Commodities Managers – Agricultural Specialists
The discretionary fundamental Ag specialists we track appeared to be consistently short soybeans and corn during the month, and therefore took advantage of corn’s -2.7% drop and beans -3.6% slide. The fundamentals clearly indicate that soybeans are oversupplied globally, while demand for US bean stocks is almost nonexistent with zero purchases from China due to tariff hostilities. Corn supply is also heavy as it looks to be a bountiful crop this year with record corn yields, but at least US exports are robust, thus minimizing the price decline. This short positioning worked for short-biased spread traders, directional options traders, and directional futures traders. Livestock traders were mixed, although the story in cattle seems fairly simple: declining supply is converging with record strong beef demand and prices are rising. There are, however, significant downside risks such that positioning at these heights is tricky and protecting against an extreme reversal is necessary and hedging expensive.
July 2025 Style Map
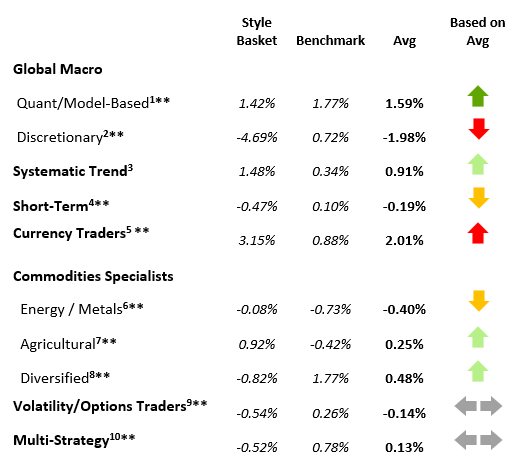
Past performance is not necessarily indicative of future results. See notes at end of this document for details on the construction of the hydra "baskets" and the benchmark used for each style class. Also note that some baskets may contain managers that have not yet reported by this date.
*=less than 75% reported.
**=less than 75% reported and absence of a core manager's return.
**********
Footnotes
The views and opinions expressed herein are those of the author and do not necessarily reflect the views of Kettera Strategies. The information set forth herein has been obtained or derived from sources believed by the author to be reliable. However, neither Kettera nor the author make any representation or warranty, express or implied, as to the information's accuracy or completeness, nor do Kettera or the author recommend that the attached information serve as the basis of any investment decision. This is provided to you solely for informational purposes only and does not constitute an offer or solicitation of an offer, or any advice or recommendation, to purchase any securities or other financial instruments, and may not be construed as such.
Kettera Strategies LLC is a Member of the National Futures Association and registered as a Commodity Pool Operator and only provides services to Accredited Investors who are Qualified Eligible Persons as defined in section 4.7 of the Commodity Exchange Act. This document, any attached document and cover email are being furnished to you on a confidential basis and may not, without prior written consent of Kettera Strategies LLC be (i) copied, photocopied or duplicated in any form, by any means, or (ii) distributed to any person that is not an employee, officer, director, or authorized agent of the intended recipient of this email. This document, and any related documents or emails, are neither offers to sell any securities, nor solicitations of an offer to invest in any fund or product.
For the “style classes” and “baskets” presented in this letter: The “style baskets” referenced above were created by Kettera for research purposes to track the category and are classifications drawn by Kettera Strategies in their review of programs on and for the Hydra Platform. The arrows represent the style basket’s overall performance for the month (e.g. the sideways arrow indicates that the basket was largely flat overall, a solid red down arrow indicates the basket (on average) was largely negative compared to most months, etc.). The “style basket” for a class is created from monthly returns (net of fees) of programs that are either: programs currently or formerly on Hydra; or under review with an expectation of being added to Hydra. The weighting of a program in a basket depends upon into which of these three groups the program falls. Style baskets are not investible products or index products being offered to investors. They are meant purely for analysis and comparison purposes. These also were not created to stimulate interest in any underlying or associated program. Nonetheless, as these research tools may be regarded to be “hypothetical” combinations of managers.
Further notes on Hydra Emerging Manager Basket: Weightings among managers were rebalanced every year, with exceptions for extraordinary events (e.g. the Covid market collapse). Weightings are not discretionary. Manager weightings were not increased over time except for going from a “pending” to a fully “approved” program; weighting reductions only occurred if the manager was de-listed or shut its doors – otherwise the managers stayed as is regardless of performance. Weightings are equal for any approval category: e.g. all fully approved managers may get a X% weighting, regardless of volatility/exposure levels or correlation with other strategies.
Hypothetical performance results have many inherent limitations, some of which are described below. No representation is being made that any product or account will achieve profits or losses similar to those shown. In fact, there are frequently sharp differences between hypothetical performance results and the actual results subsequently achieved by any particular trading program. One of the limitations of hypothetical results is that they are generally prepared with the benefit of hindsight. In addition, hypothetical trading does not involve financial risk, and no hypothetical trading record can completely account for the impact of financial risk in actual trading. There are numerous other factors related to the markets in general or to the implementation of any specific trading program which cannot be fully accounted for in the preparation of hypothetical performance results and all of which can adversely affect actual trading results.
Benchmark sources:
1- With Intelligence Systematic Macro Hedge Fund Index
2- With Intelligence Macro Hedge Fund Index
3- The Societe Generale Trend CTA Index
4- The Societe Generale Short-term Traders Index
5- The Barclay Currency Traders Index
6- Blend of Bridge Alternatives Commodity Hedge Fund Index and BarclayHedge Discretionary Traders Index
7- The Barclay Agricultural Traders Index
8- The Nilsson CTA Commodities Index
9- Blend of With Intelligence Volatility Arbitrage Index and With Intelligence Long Volatility Hedge Fund Index
10- Blend of With Intelligence Institutional Equity Hedge Multi Strategy Index and BarclayHedge Multi Strategy Index
Indices and other financial benchmarks shown are provided for illustrative purposes only, are unmanaged, reflect reinvestment of income and dividends and do not reflect the impact of advisory fees. Index data is reported as of date of publication and may be a month- to-date estimate if all underlying components have not yet reported. The index providers may update their reported performance from time to time. Kettera disclaims any obligation to verify these numbers or to update or revise the performance numbers.
Past performance is not necessarily indicative of future returns.
***
The views expressed in this article are those of the author(s) and do not necessarily reflect the views of AlphaWeek or its publisher, The Sortino Group
© The Sortino Group Ltd
All Rights Reserved. No part of this publication may be reproduced, stored in a retrieval system or transmitted in any form or by any means, electronic, mechanical, photocopying, recording or scanning or otherwise, except under the terms of the Copyright, Designs and Patents Act 1988 or under the terms of a licence issued by the Copyright Licensing Agency or other Reprographic Rights Organisation, without the written permission of the publisher. For more information about reprints from AlphaWeek, click here.


