


Noise and Nonlinearity: Challenge and Opportunity for Momentum Trading
Noise and nonlinearity are, in our view, two important market characteristics that have been on the increase over the past decade and have produced increasingly complex market price actions.
Not infrequently, difficulties in market direction trading are summed up by stereotypical phrases such as ‘there is too much noise in the market’ or ‘markets are too difficult right now’. What is really meant by this? Clearly, the frequency used by the trader making such statements to capture alpha is not working well. Over such a frequency, ‘noise’ appears to be setting in to such an extent that it ‘blurs’ the trader’s understanding of the market in question. At the same time, another trader, using a different timeframe to form a view of the same market’s direction succeeds and generates a positive return. In this example, what appears to be a hinderance for one person is overcome by another. Moreover, their roles can change in the future without notice: the formerly unsuccessful trader may start to experience successive wins over his or her frequency of choice, while the formerly successful one may start to experience losses over his or her timeframe. What is it in the markets’ dynamics that can give rise to such phenomena? Noise and nonlinearity are, in our view, two important market characteristics that have been on the increase[1] over the past decade and have produced increasingly complex market price actions. Trading such price actions has in turn become more and more challenging. This paper aims to raise awareness of this increased complexity, which invariably impacts momentum trading.
Noise
Let’s start off with noise. We hear a lot about it but what is it actually? Noise and information are antonyms. Our understanding of the reality that surrounds us is based on the information available to us. The more genuine information we can access the more knowledge we can infer and establish. Noise is what blurs our understanding and perception and gets in the way of our learning efforts. Having more noise in a signal means there is less information available for analysis and interpretation, making the forecasting of that signal difficult. In the case of markets, this means that decreased information has been carried across the price action. This is particularly relevant for the universe of markets traded by most CTAs which, as academics have pointed out, have become noisier[1].
More noise also means less predictability and less stability. After 2008, once central banks started to intervene, markets were constrained from moving as freely as before. That partial lack of freedom led to the proliferation of sideways markets, which is one manifestation of noise that naturally hinders momentum trading as market direction is unclear. However, sideways markets are not the only (or indeed least favourable) instance where noise has been increasingly felt post 2008. There is an even more dangerous type: low volatility noisy markets. Reversals following a long-term low volatility trend tend to be quite sharp and they can produce large losses very quickly. Both such instances, sideways and low volatility noise are tough challenges for momentum trading or trend following.
Since noisy markets offer less information, they are generally harder to forecast because our access to their underlying dynamic is naturally more limited. This poses a serious challenge when trying to model such markets - but not an insurmountable one. CTAs try to build systematic trading models that are based mostly or solely on price inputs and follow the perceived market direction accordingly. However, if the inputs of these models are contaminated by noise, modelling may require notable enhancements. The work required involves signal processing aimed at “de-noising” or “de-blurring” the inputs. To de-noise the inputs appropriately, you must ensure that when you take out noise, you take out just noise and make certain you leave the structure of the market intact. This is where experience in signal processing becomes very important.
There are many ways to take noise out of a signal, particularly from the price action, and in the right hands this procedure can work well, as long as the person who does this work can distinguish between structure and noise with surgical precision. There is a clear distinction between the two, but the challenge is to see this demarcation in live trading, as markets move. If during the noise reduction process one starts at some point to take out structure, this may in fact weaken the signal even further. Why is that? A noisy signal already carries decreased information. Consequently, if you reduce what precious little information is available even further, you may find that you have hurt your signal so much that there is even less information available to you than there was originally in the noisy signal. That will likely make things much worse.
This is why applying signal processing to markets is not a trivial matter. People have been applying de-noising techniques to markets for many years, and many have reported no improvement. In fact, some obtained even worse results. This does not come as a surprise - one must be exceptionally careful when undertaking these procedures.
I was formerly a mine seismologist. In seismology there are certain methods that can be employed to help distinguish between noise and information on the go. Mine seismologists evaluate the risk of experiencing a hazardous seismic event (e.g., a roof collapse) that can lead to severe consequences in underground mines. Their work involves a lot of data interpretation and their data is almost always noisy. Endless seismograms generated by the movement of rock in the underground mine are continuously processed and interpreted with the aim of estimating where and when the next large event may strike.
Can such scientific techniques be used in markets as well? What do seismology and the study of market behaviour have in common? Not much, except for perhaps one subtle yet surprisingly important factor: both disciplines seek to forecast the behaviour of a particular type of open system. As is well known, an open system exchanges various properties with the exterior beyond its borders such as matter, energy, or information. Seismologists interpret seismograms generated by the movement of rock which dissipates energy away from where the action takes place. Traders seek to understand the direction of markets which are open to receive and dissipate information as they travel. Contrary to a closed system which preserves its energy for instance, an open system does not preserve much of its characteristics and its modelling requires a fundamentally different approach. Moreover, to understand how a real-life open system evolves you normally need a team of researchers that is multi-disciplinary. That is the case in both seismology and systematic trading. Finally, time is of the essence in both disciplines as they only have one shot each time they try to forecast their respective phenomena under study: seismic events or market movements, respectively.
An example of how measuring noise in this way can be very helpful in terms of momentum trading or trend following occurred after the so-called “Trump Rally” a few years ago. In late 2017, equity markets were continuously reaching new highs. Towards the end of January 2018, the rally became so strong that markets began to go almost vertical. At the same time the VIX gauge, which measures the volatility of equity markets, continued to stay near its historical lows, i.e., it did not indicate any concerns (see Fig.1).
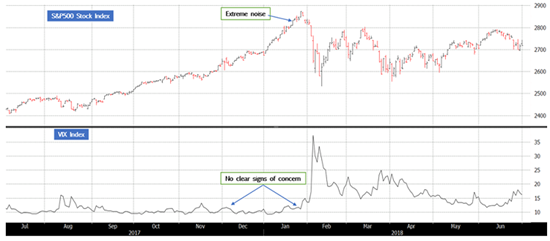
Fig.1. The S&P500 Stock Index (top panel) and the VIX Index around the time of “Volmageddon” in January/February 2018. Although the VIX gauge is not signaling any danger in late January 2018, the S&P500 price action shows extreme noise which points to price instability ahead. Very early in February 2018 the VIX Index explodes and the S&P500 experiences a large correction. Source: Bloomberg.
Measuring noise at that point in time with our techniques showed that even though the rally was strong in magnitude and the volatility was low, the noise content was immensely high. It was probably the highest amount of noise we had ever seen in the time series available in our research database at that time. From that perspective, it was clear that the price action could be highly unstable - a strong warning that direction might soon change course. What happened next? VIX exploded in early February 2018 in an event known as “Volmageddon”, the so-called volatility Armageddon. As a result, equities reversed sharply and fell apart, seriously hurting unaware momentum traders, including many trend followers. People were following the price action, it went through the sky, it felt like it was going to go to the moon and then, only days later, it collapsed.
In this example, volatility did not signal any concerns in an ex-ante way: it was in fact re-assuring the markets that the continuing low volatility rally would persist. According to our measurement process however, the noise content was very high. This illustrates a crucial point: noise and volatility are not the same thing.
Nonlinearity
Nonlinearity is often associated with chaotic behaviour. It refers to the increased sensitivity to small changes in the environment of the process being observed. In the context of markets, this high level of sensitivity relates to changes in the relevant market’s underlying conditions. We are not necessarily referring here to macro environments because often price actions do not respond to a macro theme. We are only referring to the price action itself that can change significantly. Often, we may not even know for certain the real reason or collection of reasons that caused a price change and for systematic trading that is not always important. The interpretation of a macro theme by market participants can be very different from time to time and markets can respond to such themes in surprisingly different ways.
So, what is the issue here? Just to give you an example, one big manifestation of nonlinearity took place last year, in 2020. When it sets in, nonlinearity leads to the proliferation of distinct yet tradable market regimes that occur in quick succession. Just like noise, nonlinearity has also contributed to the increased complexity seen in the markets’ price action after 2008. When they are progressively nonlinear, markets start to exhibit many different regimes within shorter and shorter timeframes, which is obviously a hurdle for momentum trading and trend following.
Consequently, one needs a way to cope with and adapt to the proliferation of these different market regimes. The case in point is 2020, last year. The year started off with a confident rally in equities. By late February, when the pandemic was not yet declared but concerns about what might happen worldwide existed, equities started to lose their consensus and crashed in March. Despite this by June those same markets that crashed in March were already making new all-time highs. This was spectacular. Now, markets and indices have crashed before (such as ’87, the “dot com” crash, 2008), but, in the past, for indices to come out of those depths to reach new historical highs took several years. Last year, just months after the crash, they were already exhibiting new highs (see Fig.2). That is a form of nonlinearity. It is important to note that this was not market volatility. Rather, it was a new market regime almost totally disjointed from what had happened in March. The crash happened at very high market volatility while the rally took place with falling volatility, so these were very different market regimes. And they occurred in quick sequence, straight after one another.
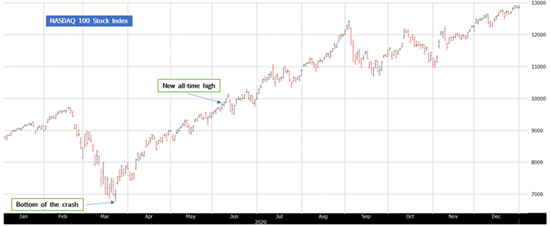
Fig.2. The Nasdaq100 Stock Index in 2020. The market crashes in March 2020 and reaches the bottom on 23 March. On 6 June the market makes a new all-time high, less than three months since the trough of the crash. Source: Bloomberg.
Later in the year, we had yet another regime, the commodities rally, a sudden yet massive market movement with commodities belligerently coming out of their bearish price action of the previous decade (see Fig.3). During 2020, a momentum trader or a trend follower had to deal with at least those three market regimes and adapt accordingly!
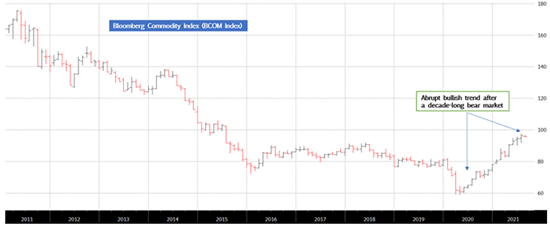
Fig.3. The Bloomberg Commodity Index (BCOM Index) since January 2011 till present (2 August 2021). Notice the abrupt bull run that originates in 2020, a very disjoined market regime from the previous decade-long persistent bear market. Source: Bloomberg.
When nonlinearity expands in markets, momentum trading must consider the potential for markets to exhibit sudden changes of market regimes which cannot necessarily be captured by volatility models or classical approaches to trend following. You need something else to characterise markets when they change like that - something that deals with the underlying dynamics of the price action itself.
Concluding remarks
We have described here some of the challenges associated with noise and nonlinearity. In terms of the opportunity set here, how can a momentum trader still benefit from an environment that has become so complex?
The trader will have to recognise these complexities and not be intimidated by them. We pointed out that markets are open systems. As a consequence, they are expected to lose and receive information all the time without any warning or notice whatsoever. As long as one is prepared for that, mentally as well as scientifically, one has a chance of dealing with it. If one fails to recognise this problem, the chances of succeeding at forecasting the market direction in a complex environment are random.
Trends still exist. This is encouraging and important to point out, particularly for the managed futures sector. Markets continue to move in a directional way, but trends have become more complicated. One must therefore decode the underlying dynamic that defines the processes governing the formation of these trends.
Select signal processing techniques, such as those used in seismology, may to some extent help identify these market regimes, their onset, and their extent. Such methods can be automated and incorporated into a systematic market-timing engine that can also be used for capturing more complex trends. The secret is to be able to use signal processing in order to distinguish between noise and structure as surgically as possible.
In terms of nonlinearity, there are specific techniques that can be borrowed from the field of nonlinear dynamics which can help to model the expected sensitivity of the price action when certain changes are detected in the market. Last year was a great example of where trend following had the potential to succeed using this kind of approach to extract at least three types of alpha from markets, including a precious crisis alpha in March 2020.
In our view, those trend followers and other directional traders that recognise and adapt to these challenges are more likely to outperform in the future.
**********
Stefanel Radu is Head of Research at BHDG Systematic Trading / DG Partners
Footnotes
- [1] Salim Lahmiri, Gazi Salah Uddin and Stelios Behiros: Nonlinear dynamics of equity, currency and commodity markets in the aftermath of the global financial crisis, in Chaos, Solitons and Fractals, 103 (2017) 342-346
This document has been prepared by BH-DG Systematic Trading LLP (“BH DG”). BH-DG is authorised and regulated by the United Kingdom Financial Conduct Authority and only provides services to professional clients. This document is provided for information purposes only and does not constitute investment advice. Commodity trading involves substantial risk of loss.
***
The views expressed in this article are those of the author and do not necessarily reflect the views of AlphaWeek or its publisher, The Sortino Group
© The Sortino Group Ltd
All Rights Reserved. No part of this publication may be reproduced, stored in a retrieval system or transmitted in any form or by any means, electronic, mechanical, photocopying, recording or scanning or otherwise, except under the terms of the Copyright, Designs and Patents Act 1988 or under the terms of a licence issued by the Copyright Licensing Agency or other Reprographic Rights Organisation, without the written permission of the publisher. For more information about reprints from AlphaWeek, click here.